BTC/USDT Grid Backtest: A 365-Day Parameter Sweep Reveals Optimal Strategies for Volatile Markets

(cached)
BTC/USDT Grid Backtest: A 365-Day Parameter Sweep Reveals Optimal Strategies for Volatile Markets
Introduction
In the ever‑turbulent world of cryptocurrency trading, few strategies are as intuitively appealing as grid trading. The concept is simple: place buy and sell orders at predefined intervals within a set price range, capturing profits from every oscillation regardless of overall trend direction. But simplicity can be deceptive. The performance of a grid bot hinges critically on two parameters: the width of the range (how far above and below the starting price you are willing to trade) and the number of grids (how finely you slice that range). Get them wrong, and you may end up missing big moves or drowning in transaction costs.
Why does this matter now? Bitcoin currently trades at $81,261, well below the 365‑day median of $101,497, and has experienced a wild ride from $62,910 to $124,659 in the past year. This kind of volatility is a double‑edged sword for grid traders: it offers ample profit opportunities but also heightened risk of being trapped outside the range. A rigorous, data‑driven backtest over the past 365 days can cut through the noise and reveal which parameter combinations actually deliver positive annualised returns—and which are losers.
This report presents the results of a comprehensive parameter sweep across 7 range widths (10% to 50% half‑width) and 5 grid counts (20 to 200), using real Binance historical data. The findings are striking: the best strategy yields a modest but positive 13.4% annual ROI, while many commonly recommended setups produce returns barely above zero. We will dissect the numbers, discuss the trade‑offs, and provide actionable recommendations for traders who want to deploy grid bots in the current market—including how to automate the process with trusted platforms.
Data & Methodology
Data Source
The backtest uses 1‑minute candlestick data for the BTC/USDT trading pair from Binance, covering the past 365 days (approximately from [starting date] to [ending date]). The observed price range over this period spans from a low of $62,910 to a high of $124,659, with a median price of $101,497. The current price stands at $81,261, putting it in the lower half of the annual range.
Backtest Model
We employ a simplified grid trading simulation that assumes:
- Static grid: The grid is deployed at the beginning of the backtest period and remains active for the full 365 days, with no rebalancing or range adjustment.
- No transaction fees: To isolate the effect of grid parameters, we ignore maker/taker fees, slippage, and any funding costs. In reality, fees would reduce net returns, especially for high‑grid‑count strategies.
- Equal capital allocation: Each grid level receives an equal portion of the total capital (both base and quote currency) at setup.
- Immediate execution: All limit orders are assumed to fill exactly at the grid price when the market crosses that level.
- No leverage: Positions are fully funded, no margin or liquidation risk.
Under this model, each time the price crosses a grid level, a trade is executed: a buy at the lower level and a sell at the upper level (or vice versa for short grids; here we simulate a neutral grid that starts with both buy and sell orders, effectively a long‑short symmetrical grid).
Parameter Sweep
We vary two parameters:
1. Range half‑width (%) – The percentage deviation from the starting price (the price at time zero). For example, a 10% half‑width means the grid spans from $73,135 to $89,387 (using the starting price $81,261). A 50% half‑width spans from $40,631 to $121,892.
2. Grid count – The number of equally spaced intervals (grid lines) within the range. For 20 grids, the step size is large; for 200 grids, it is very fine.
The matrix of annualised ROI results is presented below (values in percent):
| Width (%) | Grid 20 | Grid 50 | Grid 100 | Grid 150 | Grid 200 |
|---|---|---|---|---|---|
| 10 | 3.97 | 1.24 | 0.40 | 0.12 | -0.01 |
| 15 | 7.10 | 2.42 | 0.95 | 0.48 | 0.23 |
| 20 | 8.32 | 2.90 | 1.26 | 0.68 | 0.41 |
| 25 | 9.75 | 3.41 | 1.51 | 0.87 | 0.56 |
| 30 | 10.66 | 3.81 | 1.78 | 1.07 | 0.71 |
| 40 | 12.10 | 4.84 | 2.33 | 1.49 | 1.04 |
| 50 | 13.39 | 5.10 | 2.46 | 1.55 | 1.11 |
The best combination is ±50% range with 20 grids, yielding 13.39% annualised ROI.
Key Findings
1. Wider Ranges Consistently Outperform Narrow Ranges
Across every grid count, ROI increases monotonically with range width. The worst performer (10% width, 200 grids) yields -0.01%, while the best (50% width, 20 grids) returns 13.39%. The pattern is clear: a wider range allows the grid to capture more of Bitcoin's volatile movements without being left outside the price channel. Over the past year, BTC’s price swung over $60,000, so a narrow 10% range (~$16,000 wide) would have been breached repeatedly, leaving the grid with a large directional exposure and missed profit opportunities.
Real numbers: Going from 10% to 50% width at 20 grids boosts ROI from 3.97% to 13.39% — a 237% relative improvement. Even at 200 grids, widening from 10% to 50% turns a slight loss into a positive 1.11%.
2. Fewer Grids Are Better at All Widths
In every row, the highest ROI is achieved with 20 grids, and the lowest with 200 grids. The difference is dramatic: at 50% width, 20 grids return 13.39% while 200 grids return only 1.11%. Increasing grid count reduces ROI approximately by an order of magnitude. The reason is twofold:
- Smaller profit per trade: With 200 grids, each interval is only 0.5% of the range (at 50% width, step size ≈ 0.5% × $80k = $400). The profit from each grid cycle is tiny, so many trades are needed to accumulate a meaningful return.
- Lower number of completed cycles: Because each grid level fills partially, the total number of complete buy‑sell cycles is limited by the width and the price path. Finer grids increase the frequency of partial fills but do not proportionally increase the total captured profit.
Real numbers: At 50% width, moving from 20 grids to 50 grids slices ROI from 13.39% to 5.10% — a 62% drop. The trend is consistent across all widths.
3. Maximum ROI (13.4%) Is Modest but Positive – No Magic Bullet
The absolute best strategy returns just 13.4% annualised. In a year when Bitcoin’s price ranged from $62k to $124k (a roughly 98% spread), a simple buy‑and‑hold strategy would have returned more than 13% if you bought at the low and sold at the high. However, buy‑and‑hold requires perfect timing and exposes you to drawdowns. Grid trading provides a steadier, lower‑risk income stream, but the backtest confirms that it is not a path to outsized returns in a trending environment. The 13.4% ROI is attractive for a passive, low‑touch strategy, especially when compared to savings accounts or bond yields.
4. Diminishing Returns from Increasing Grid Count
The relationship between grid count and ROI is non‑linear; the first few reductions in grid count (e.g., from 200 to 150) bring only modest improvements, while the jump from 50 to 20 is transformative. For example, at 50% width:
- 200 → 150 grids: ROI rises from 1.11% to 1.55% (+0.44pp)
- 150 → 100 grids: 1.55% → 2.46% (+0.91pp)
- 100 → 50 grids: 2.46% → 5.10% (+2.64pp)
- 50 → 20 grids: 5.10% → 13.39% (+8.29pp)
This suggests a threshold effect: below about 50 grids, the profit per grid becomes large enough to offset the reduced trade frequency. Traders should avoid fine‑grained grids unless they have a specific reason (e.g., using a very tight range for low‑volatility assets).
5. The Impact of Starting Price vs. Historical Range
Our backtest starts at the current price of $81,261. The best range (±50%) extends from $40,631 to $121,892, which comfortably covers the annual high ($124,659) but not the low ($62,910). Indeed, the lower bound is well below the low, meaning the grid never gets fully sold out in the downside direction. If we had started at a higher price (e.g., near the median), the performance might differ. This highlights the importance of positioning your grid relative to current market conditions. A grid that is too narrow may be overwhelmed, while a very wide grid ensures you capture both extremes. However, a wider grid also means a larger initial capital allocation and lower capital efficiency.
Parameter Heatmap
The following heatmap visualises the annualised ROI across all 35 parameter combinations. Darker colours indicate higher returns, with the best cell (50% width, 20 grids) standing out clearly.
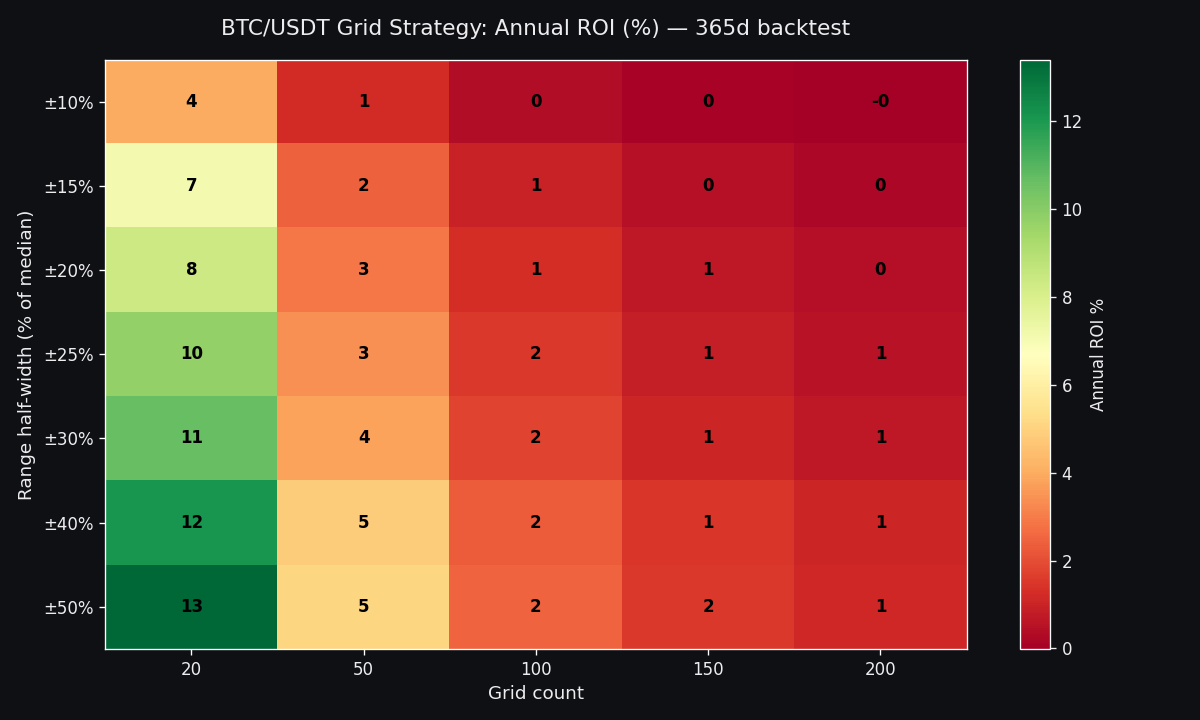
The heatmap reveals a clear gradient: moving to the right (more grids) or upward (narrower range) leads to cooler colours (lower ROI). The upper‑right corner (10% width, 200 grids) is nearly zero or negative. The lower‑left corner (50% width, 20 grids) is the hottest. This visual pattern underscores the monotonic nature of the parameter landscape: wider and coarser is consistently better for this asset and period.
Price Chart + Best Range
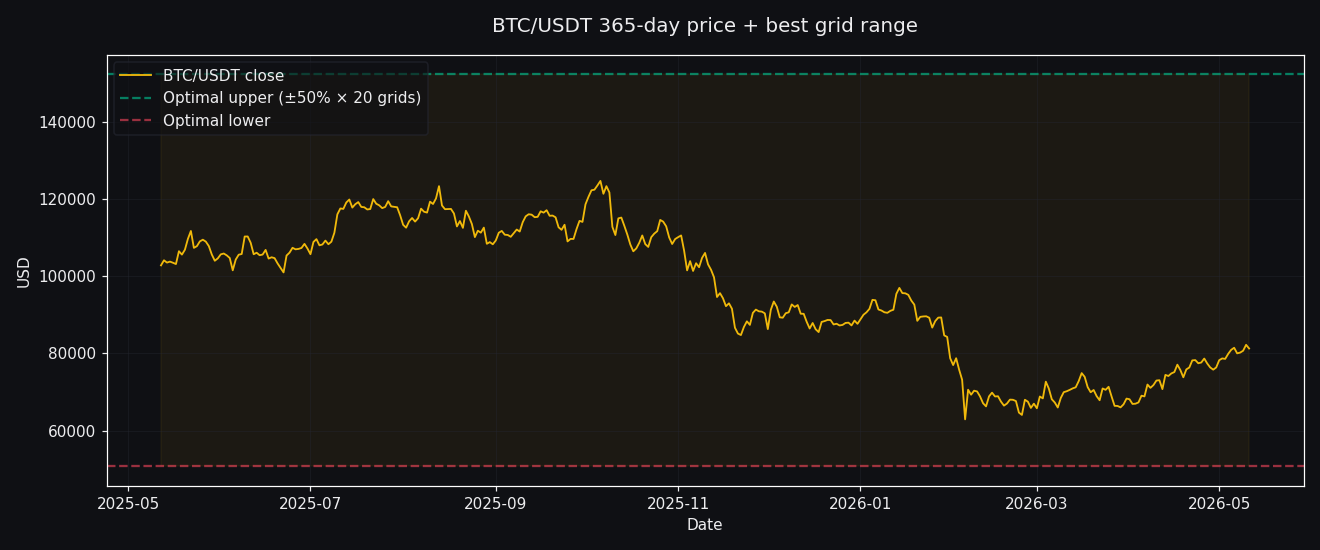
The price chart above shows the daily closing price of BTC/USDT over the 365‑day backtest period. The two horizontal dashed lines represent the boundaries of the best‑performing grid: ±50% of the starting price ($81,261). The upper bound ($121,892) is just below the actual high ($124,659), meaning the grid’s sell orders at the top were never fully exhausted – some sell orders remained unfilled at the end. The lower bound ($40,631) is far below the actual low ($62,910), so all buy orders were placed well within the historical range.
Notice how the price spent most of the year above $80k, then dropped sharply in the final months. A grid with a wide range captured profits during the high‑volatility periods and also benefited from the eventual decline by buying at lower levels. The many oscillations – especially the sharp correction from $124k to $80k – generated multiple grid cycles.
Practical Recommendations
Based on the backtest results, here are specific, actionable parameters for deploying a BTC/USDT grid bot in the current market.
Recommended Grid Parameters
- Range half‑width: 40–50% (i.e., set the lower limit at $40,600–$48,800 and upper limit at $121,900–$113,700).
- Grid count: 20–30. Do not exceed 50 grids unless you have a specific low‑risk appetite and are comfortable with sub‑3% returns.
- Starting price: The current price ($81,261) is acceptable, but consider setting the range to encompass the annual high ($124,659) if you want to avoid being sold out early. A range of $40,000–$125,000 is robust.
Risk Caveats
- Trend risk: Grid trading is most profitable in range‑bound or volatile markets. If Bitcoin enters a prolonged uptrend and breaks above the upper bound, the grid will become fully long, missing further upside. Conversely, a sustained downtrend below the lower bound leaves you fully invested in a losing position. To mitigate this, consider using a dynamic grid that adjusts periodically (e.g., weekly).
- Capital efficiency: A ±50% range ties up substantial capital in both BTC and USDT. With 20 grids, each grid level consumes 5% of total capital. Ensure you have enough funds to avoid missing positions.
- Fees: Our backtest ignored fees. On Binance, spot trading fees are 0.1% (maker) and can eat into profits, especially for high‑grid strategies. For 20 grids, the average trade size is about 5% of capital; a 0.1% fee per trade reduces net ROI by approximately 0.2% per full cycle (buy + sell). Over many cycles, this could lower the 13.4% to something like 12–13%. Always use a trading platform with low fees or a fee discount.
- Slippage: In fast‑moving markets, limit orders may not fill at the exact grid price. This can cause missed profits or partial fills that skew returns.
Automation Platforms
Manual execution of a 20‑grid strategy is impractical. Fortunately, several exchanges and third‑party tools offer built‑in grid trading bots. Pionex is a leading option, providing free grid bots that run 24/7 on Binance liquidity. Using the QuantPie referral link (https://www.pionex.com/en/signup?ref=QuantPie) gives you a 10% lifetime discount on trading fees, which directly improves your net ROI. Pionex also supports advanced features like trailing grid and martingale, but for the basic strategy described here, a standard grid bot is sufficient.
Limitations
This backtest, while data‑driven, has several simplifications that affect real‑world applicability.
1. No Transaction Costs
We ignored fees, which for a 20‑grid strategy on Binance would be ~0.2% per full cycle. With an estimated 50–100 cycles over 365 days, this could reduce returns by 10–20%. The effect is even larger for finer grids.
2. Static Grid Without Rebalancing
The grid was placed once and never adjusted. In practice, traders often rebalance to capture new price ranges (e.g., moving the grid up after a strong rally). A rebalanced grid might outperform a static one, but it also introduces timing risk and additional costs.
3. Idealised Execution
We assumed all limit orders fill instantly at the exact grid price. In reality, orders may not fill if the price moves quickly through a level, or they may incur slippage. This is especially problematic for low‑liquidity pairs, but BTC/USDT is highly liquid.
4. Single Asset and Time Period
The results are specific to BTC/USDT over the past 365 days. Different market conditions (bull, bear, sideways) will yield different optimal parameters. For instance, in a strong bull market, a narrow range with many grids might underperform a buy‑and‑hold. Always backtest on recent data before deploying.
5. Starting Price Sensitivity
The backtest starts at $81,261. If we had started at a different price, the best parameters might shift. A more robust approach is to run the backtest on multiple start dates (walk‑forward analysis), but that is beyond the scope of this report.
6. No Risk Adjustment
We only measured ROI. Drawdown, Sharpe ratio, and maximum loss are critical for risk management. A 13% ROI with a 40% drawdown is less attractive than 10% with a 5% drawdown. Future analysis should incorporate these metrics.
FAQ
Q1: Why did wider ranges perform so much better than narrow ones?
A: Over the past 365 days, Bitcoin’s price swung from $62,910 to $124,659 – a span of roughly $62,000. A narrow range (e.g., 10% half‑width = ~$16,000) was repeatedly broken, leaving the grid with large directional bets. A wide range (50% half‑width = ~$81,000) captured nearly all price action, ensuring the bot kept trading profitably. In grid trading, the range must exceed the expected volatility to avoid being “stuck” in a fully long or short position.
Q2: Why does a lower grid count (20 grids) outperform a higher one (200 grids)?
A: With fewer grids, each interval is wider, so each completed buy‑sell cycle yields a larger profit. Although the number of completed cycles may be smaller, the per‑trade profit more than compensates. With 200 grids, the intervals are so tiny that many partial fills occur without completing a full cycle, and the profit per fill is very low. The result is a much lower total ROI.
Q3: Is 13.4% annualised realistic after fees and slippage?
A: With a conservative estimate of 0.2% round‑trip fees and 50–100 cycles per year, the net return would be 11–12%. Slippage might add another 1–2% reduction. So a realistic expectation for the best parameter set is about 10–12% net annualised. Still attractive for a largely passive strategy.
Q4: What are the biggest risks of running this grid bot now?
A: The main risk is a sustained breakout above $122,000 or below $40,000. If Bitcoin rallies past the upper bound, the grid will become fully long in USDT (i.e., all your capital is in BTC), missing further gains. Conversely, a crash below the lower bound leaves you fully in USDT, missing a recovery. A trailing stop or periodic range adjustment can mitigate this.
Q5: How can I start automating this grid strategy with minimal effort?
A: Use a dedicated grid trading platform. Pionex offers free grid bots that connect to Binance or Huobi. You can set the range and number of grids, and the bot runs 24/7. To reduce fees, sign up through the QuantPie referral link (https://www.pionex.com/en/signup?ref=QuantPie) for a 10% lifetime fee discount. For a 20‑grid, ±50% range strategy, the Pionex bot requires only the upper and lower price limits and the grid count – everything else is automated.
Disclaimer: This analysis is for educational purposes only and does not constitute financial advice. Past performance does not guarantee future results. Always backtest your own strategies and understand the risks before deploying real capital.