BTC ETH Daily Recap: June 5, 2026 — Sharp Selloff Tests Critical Support Levels
BTC ETH Daily Recap: June 5, 2026 — Sharp Selloff Tests Critical Support Levels
Today at a Glance
The cryptocurrency market experienced a severe selloff on June 5, 2026, with Bitcoin and Ethereum both registering significant losses. Bitcoin dropped 5.16% in the last 24 hours, falling from a high of $63,978 to a low of $60,588, its lowest point in the past 30 days. The asset has now declined 17.52% over the past week and 24.27% over the past month. Ethereum faced even steeper declines, losing 9.30% in the daily session, sliding from $1,775 to $1,606. The altcoin leader has shed 20.27% in the last seven days and 29.90% over the past 30 days, underperforming Bitcoin significantly. Both assets are trading well below their key moving averages, with the Relative Strength Index (RSI) plunging into deeply oversold territory — Bitcoin at 11.4 and Ethereum at 12.6. Trading volumes have surged, with Ethereum seeing 1.67 times its 7-day average volume, indicating heightened panic selling and capitulation.
Bitcoin Analysis
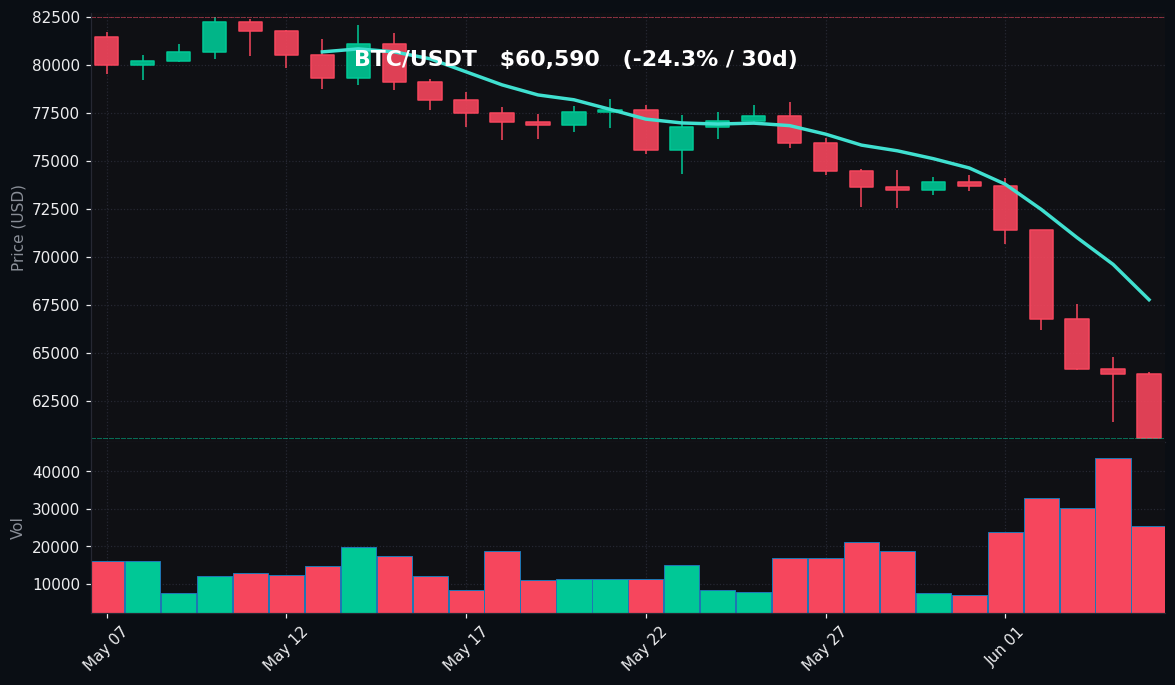
TradingView Live (4h)
Bitcoin’s price action on June 5, 2026, reflects a continuation of the bearish trend that has dominated the past month. The asset opened the day near $63,900 but quickly succumbed to selling pressure, sliding through the session to touch an intraday low of $60,588. This level represents a critical juncture, as it is the lowest price recorded in both the 7-day and 30-day periods. The current price of $60,590 is well below the 7-day moving average of $67,764 and the 30-day moving average of $75,598, confirming that the short-term and medium-term trends are firmly bearish. The spread between the current price and the 30-day MA is approximately $15,008, or 19.9%, a significant deviation that typically signals extreme bearish momentum.
Technical levels to watch include the $60,000 psychological support zone. A breakdown below this level could open the door to further declines toward the $55,000 area, which served as support in late 2025. On the upside, resistance is now found at the 7-day MA of $67,764, followed by the $70,000 round number. The $74,276 7-day high is a distant resistance level that would require a substantial reversal to retest.
Volume analysis shows that trading activity is elevated relative to the 7-day average, with a volume ratio of 1.08x. This suggests that selling pressure is intensifying, but the increase is not yet at panic levels seen in previous capitulation events. The RSI(14) reading of 11.4 is deeply oversold — levels below 30 are considered oversold, and a reading below 15 is rare and historically associated with short-term bottoms or at least a pause in the downtrend. However, in a strong bear trend, RSI can remain oversold for extended periods, and a bounce should not be assumed without confirmation. The lack of any significant intraday recovery from the lows indicates that buyers are not yet stepping in aggressively.
The 24-hour range of $60,588 to $63,978 is relatively wide, reflecting heightened intraday volatility. The close near the low of the range suggests that sellers remain in control heading into the next session. Momentum indicators point to continued downside risk, with the next major support level being the $60,000 handle, followed by the $58,000 area.
Ethereum Analysis
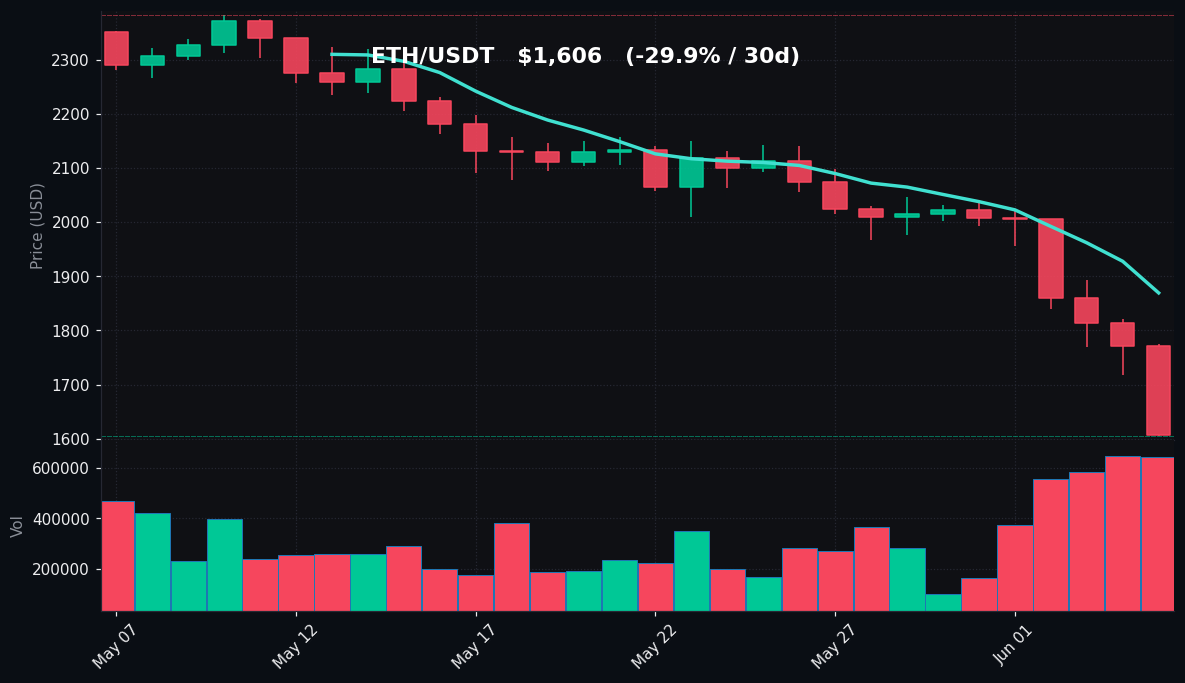
TradingView Live (4h)
Ethereum’s performance on June 5, 2026, was markedly worse than Bitcoin’s, with the asset losing 9.30% in the daily session. The price dropped from a high of $1,775 to a low of $1,606, a decline of $169, or 9.5% from peak to trough. This marks the lowest price for Ethereum in both the 7-day and 30-day periods, surpassing the previous low of $1,606 set earlier in the session. The current price of $1,606 is now 23.6% below the 7-day moving average of $1,869 and a staggering 31.4% below the 30-day moving average of $2,103. These deviations are extreme and highlight the severity of the current selloff.
The technical picture for Ethereum is even more bearish than Bitcoin’s. The asset has broken below the $1,700 support level, which had been a key floor in recent weeks, and is now testing the $1,600 psychological support. A breakdown below $1,600 could lead to a swift decline toward the $1,500 area, which has not been tested since late 2024. On the upside, immediate resistance is at the $1,700 level, followed by the 7-day MA of $1,869. The $2,038 7-day high is a distant resistance that would require a major reversal to approach.
Volume data reveals significant capitulation. Ethereum’s trading volume is 1.67 times its 7-day average, indicating a substantial increase in market participation. This elevated volume during a sharp price decline is characteristic of panic selling, often seen at market bottoms but also during trend continuation. The RSI(14) reading of 12.6 is even more oversold than Bitcoin’s, entering territory that has historically preceded short-term bounces. However, similar to Bitcoin, an oversold RSI does not guarantee an immediate reversal, especially in a market where Ethereum is underperforming its larger counterpart.
The 24-hour range of $1,606 to $1,775 is wide, reflecting extreme intraday volatility. The price closed near the low of the range, indicating that sellers maintained control throughout the session. The lack of any meaningful bounce from the lows suggests that buying interest is minimal at current levels. Ethereum’s relative weakness compared to Bitcoin is a concerning signal for the broader altcoin market, as it often leads further declines in smaller-cap assets.
Key Technical Levels
| Asset | Support | Resistance | RSI |
|---|---|---|---|
| BTC | $60,000 | $67,764 (7-day MA) | Oversold (11.4) |
| ETH | $1,600 | $1,700 | Oversold (12.6) |
BTC vs ETH Dynamic
The correlation between Bitcoin and Ethereum remains strong, but the divergence in performance is notable. Bitcoin’s 24-hour decline of 5.16% is less severe than Ethereum’s 9.30% drop, continuing a trend of Bitcoin outperforming the broader market. The BTC/ETH ratio has risen, reflecting capital rotating out of altcoins and into Bitcoin, or simply Bitcoin holding up better during the selloff. Ethereum’s 30-day decline of 29.90% is nearly 6 percentage points worse than Bitcoin’s 24.27% loss. This underperformance is typical during bearish phases, as Ethereum and altcoins tend to have higher beta to Bitcoin. The correlation coefficient between the two assets remains above 0.85, meaning they move largely in tandem, but the magnitude of Ethereum’s moves is amplified. For traders, this means that long positions in Ethereum carry higher risk during downturns, while Bitcoin offers relatively more stability. The current dynamic favors Bitcoin as a relative safe haven within the crypto space, but both assets are in a clear downtrend.
Strategy Fit
Given the current market conditions — extreme bearish momentum, deeply oversold RSI readings, and elevated volatility — a conservative approach is warranted. Trend-following strategies are not recommended, as the trend is clearly down, and attempting to catch a falling knife carries significant risk. The oversold RSI may tempt some traders to buy the dip, but without confirmation of a reversal, such trades are highly speculative.
A grid trading strategy can be effective in this environment, particularly if the market enters a consolidation phase after the sharp decline. Grid bots, such as those available on Pionex, can profit from mean reversion within a defined range. For example, a grid bot set between $58,000 and $63,000 on Bitcoin could capture profits from short-term oscillations. However, the risk of a breakdown below support must be managed with appropriate stop-loss levels or by setting the grid range wide enough to accommodate further downside.
Dollar-cost averaging (DCA) is another suitable strategy for long-term investors. The current price levels represent a significant discount from the 30-day highs, and DCA can help reduce the average entry price over time. Pionex’s DCA bots allow for automated, disciplined accumulation without emotional interference. Given the oversold conditions, starting a DCA bot at current levels with a focus on Bitcoin may be prudent, as it has shown relative strength.
Trend-following strategies should be avoided until the market shows clear signs of a reversal, such as a break above the 7-day moving average or a higher low formation. The current environment is not favorable for momentum-based bots.
In summary, a defensive posture with grid trading for short-term mean reversion and DCA for long-term accumulation is the most appropriate approach. Pionex’s automated bots can execute these strategies efficiently, allowing traders to navigate the volatile market without emotional bias.
Risk Disclaimer
This market recap is provided for informational and educational purposes only and does not constitute financial advice, investment advice, or a recommendation to buy, sell, or hold any cryptocurrency. Trading cryptocurrencies involves substantial risk, including the potential loss of principal. Past performance is not indicative of future results. The technical analysis and strategies discussed are based on current market data and may not be suitable for all investors. You should conduct your own research and consult with a qualified financial advisor before making any investment decisions. The author and platform do not assume any liability for losses incurred as a result of using this information.
FAQ
Q: Why are Bitcoin and Ethereum dropping so sharply today?
A: The sharp declines on June 5, 2026, are driven by a combination of factors, including continued selling pressure from the past month, breakdown of key support levels, and heightened market fear. Bitcoin fell 5.16% to $60,590, while Ethereum dropped 9.30% to $1,606. Both assets are trading well below their 7-day and 30-day moving averages, and the RSI is in deeply oversold territory, reflecting panic selling.
Q: Is the RSI oversold reading a signal to buy?
A: An RSI below 30 is typically considered oversold, and readings below 15 (Bitcoin at 11.4, Ethereum at 12.6) are extreme. Historically, such levels have sometimes preceded short-term bounces, but they can also persist during strong downtrends. An oversold RSI alone is not a reliable buy signal and should be confirmed by other technical indicators, such as a bullish candlestick pattern or a break above resistance.
Q: What are the key support levels to watch for Bitcoin and Ethereum?
A: For Bitcoin, the immediate support is at the $60,000 psychological level. A break below could lead to a test of $58,000 and then $55,000. For Ethereum, support is at $1,600, with a breakdown potentially targeting $1,500. Resistance levels are at the 7-day moving averages: $67,764 for Bitcoin and $1,869 for Ethereum.
Q: How does the current volatility affect trading strategies?
A: High volatility increases both profit potential and risk. Trend-following strategies are not recommended in a clear downtrend. Grid trading between support and resistance can profit from mean reversion, while DCA bots allow for disciplined accumulation at lower prices. Both strategies are available on Pionex and can be automated to reduce emotional decision-making.
Q: Should I be worried about further declines?
A: The market is in a bearish phase, with Bitcoin down 24.27% and Ethereum down 29.90% over the past 30 days. Further declines are possible, especially if key support levels like $60,000 for Bitcoin or $1,600 for Ethereum are broken. However, the market is deeply oversold, which could lead to a temporary relief rally. Risk management, including position sizing and stop-losses, is crucial in this environment.