BTC ETH Daily Recap – May 31, 2026: Consolidation at Key Support Levels
BTC ETH Daily Recap – May 31, 2026: Consolidation at Key Support Levels
Today at a Glance
The crypto market witnessed a subdued session on May 31, 2026, with both Bitcoin and Ethereum trading in narrow ranges amid low volatility. Bitcoin (BTC) closed at $73,795, down 0.12% over the past 24 hours, after touching a daily high of $74,276 and a low of $73,699. The leading cryptocurrency is now trading 4.24% lower over the past week and 6.22% lower over the past 30 days, reflecting a persistent bearish pressure that has eroded gains from earlier in the month. Ethereum (ETH) similarly struggled, ending the day at $2,019, down 0.16% in the last 24 hours, with a daily range of $2,015 to $2,038. ETH’s weekly decline of 3.84% and monthly drop of 12.85% highlight a weaker relative performance compared to BTC. Notably, trading volumes for both assets are sharply below their 7-day averages—BTC at 0.27x and ETH at 0.24x—indicating a market in a holding pattern as traders await clearer directional cues. The RSI(14) readings of 31.0 for BTC and 32.0 for ETH place both assets in oversold territory, suggesting that selling pressure may be exhausting, though confirmation from volume and price action is still lacking.
Bitcoin Analysis

TradingView Live (4h)
Bitcoin’s price action on May 31, 2026, reflects a market in a consolidation phase after a significant decline from the 30-day high of $82,850 recorded on May 1. The current price of $73,795 sits below both the 7-day moving average (MA7) of $74,637 and the 30-day moving average (MA30) of $78,025, confirming a bearish short- to medium-term trend. The MA7 has crossed below the MA30, a classic “death cross” pattern that often signals continued downside pressure. However, the rate of decline has slowed, with the 24-hour range of $73,699 to $74,276 being the tightest in recent weeks, suggesting that sellers are losing momentum.
Key technical levels to watch include immediate support at the 7-day low of $72,512, which was tested on May 29 and held firmly. A break below this level could open the door to the psychological $70,000 zone. On the upside, resistance is clustered around the MA7 at $74,637, followed by the $76,000 area, which previously acted as support. The RSI(14) reading of 31.0 is deeply oversold—below the 30 threshold would confirm oversold conditions, but the current level already indicates that selling pressure is extreme by historical standards. Volume is critically low at 0.27x of the 7-day average, which is a double-edged sword: low volume can precede a sharp move in either direction, but it also suggests that institutional participation is muted. The lack of volume during the recent decline raises the risk of a “dead cat bounce” rather than a sustainable recovery. For now, Bitcoin remains in a bearish structure, but the oversold RSI and narrowing range hint that a short-term relief rally could materialize if buyers step in above $73,500.
Ethereum Analysis
TradingView Live (4h)
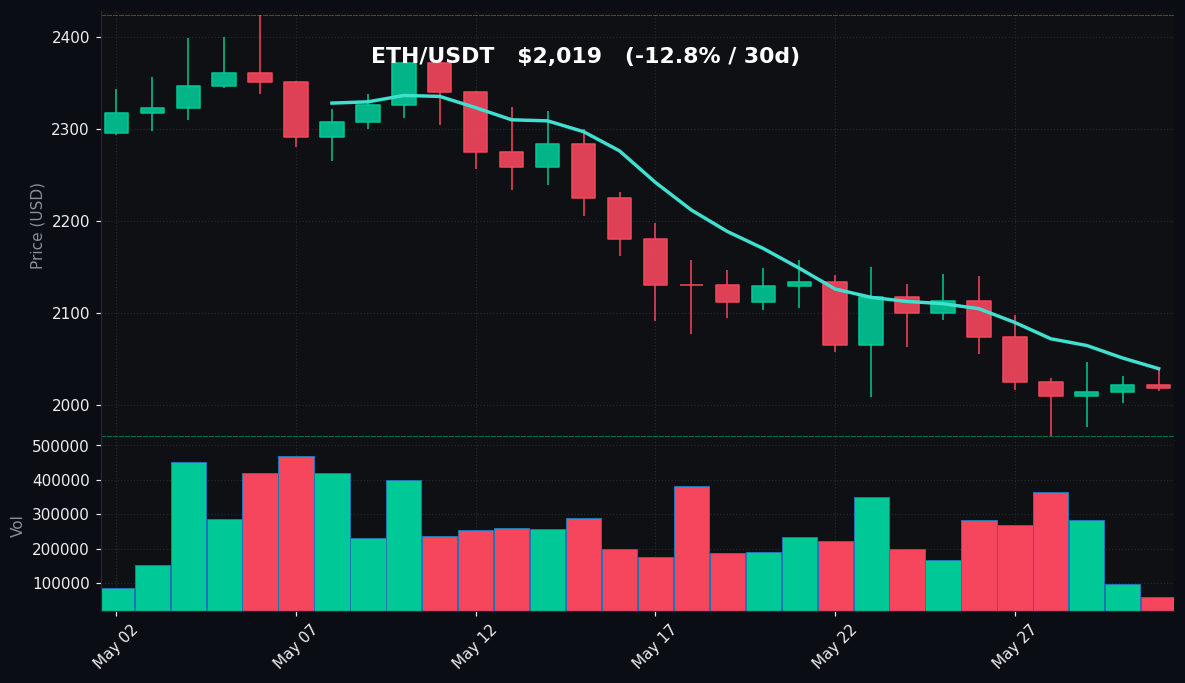
Ethereum’s trading session on May 31, 2026, was similarly lackluster, with the asset closing at $2,019 after a 0.16% decline. The daily range of $2,015 to $2,038 was the narrowest in the past two weeks, reflecting a market in a state of indecision. ETH is trading below both its MA7 of $2,040 and MA30 of $2,192, with the MA7 trending downward and the MA30 sloping lower, confirming a bearish trend that has accelerated over the past month. The 30-day decline of 12.85% is nearly double that of Bitcoin’s 6.22% drop, indicating that ETH is underperforming BTC on a relative basis—a common pattern during risk-off periods in crypto.
The immediate support level for ETH is the 7-day low of $1,967, which was tested on May 29 and May 30. A breakdown below this level would target the $1,900 psychological support, while a move above $2,038 (the daily high) could lead to a retest of the MA7 at $2,040. The RSI(14) of 32.0 is also in oversold territory, though slightly above the 30 threshold that would signal extreme oversold conditions. Volume is notably low at 0.24x of the 7-day average, similar to BTC, suggesting that the market is waiting for a catalyst. The declining volume during the price drop is a bearish divergence—typically, a healthy downtrend sees increasing volume as sellers become more aggressive. The current low-volume decline suggests that selling pressure is waning, but it also means that any rally may lack conviction. Ethereum’s structure remains fragile, and the asset is at risk of a further leg down if BTC fails to hold its support. However, the oversold RSI and the proximity to the $1,967 support zone create a setup for a potential bounce, albeit one that should be treated with caution given the low volume backdrop.
Key Technical Levels
| Asset | Support | Resistance | RSI |
|---|---|---|---|
| BTC | $72,512 | $74,637 | oversold (31.0) |
| ETH | $1,967 | $2,040 | oversold (32.0) |
BTC vs ETH Dynamic
The correlation between Bitcoin and Ethereum remains elevated, as both assets are experiencing similar technical conditions—oversold RSI readings, low volume, and price action below key moving averages. However, Ethereum’s relative weakness is notable: over the past 30 days, ETH has lost 12.85% compared to BTC’s 6.22%, and the ETH/BTC ratio has declined to approximately 0.0274, near its lowest level in several months. This divergence is typical of a risk-off environment where capital flows into the relative safety of Bitcoin, which is perceived as a more resilient store of value. The daily performance is nearly identical (both down ~0.15%), suggesting that short-term traders are treating both assets similarly, but the medium-term trend favors BTC. If a recovery materializes, ETH may lag initially, but given its higher beta, it could outperform BTC in a sustained rally. For now, the dynamic is one of caution: both assets are oversold, but ETH’s deeper monthly decline and lower volume make it more vulnerable to a breakdown below $1,967.
Strategy Fit
Given the current market conditions—low volume, oversold RSI, and consolidation near support levels—a range-bound or mean-reversion strategy is most appropriate. The narrow daily ranges and low volatility suggest that trend-following strategies may generate whipsaws, while momentum trading is risky due to the lack of directional conviction. A grid trading bot, such as those available on Pionex, is well-suited for this environment. By placing buy orders near support (e.g., $72,512 for BTC and $1,967 for ETH) and sell orders near resistance (e.g., $74,637 for BTC and $2,040 for ETH), traders can capture small profits from the price oscillations within the current range. The oversold RSI also makes DCA (dollar-cost averaging) a viable strategy for long-term holders, as accumulating at these levels could reduce average entry prices if the market recovers. However, given the bearish trend, a DCA approach should be executed with smaller increments and a defined budget to manage risk. For more aggressive traders, a short-term momentum bot could be used if a breakout above resistance occurs, but the low volume argues against chasing breakouts until volume picks up. Pionex’s built-in bots, including the Grid Trading Bot and DCA Bot, can automate these strategies without requiring constant monitoring, making them ideal for the current low-volatility environment. Risk management is critical: stop-losses should be placed just below support levels to protect against a breakdown.
Risk Disclaimer
This market recap is provided for informational and educational purposes only and does not constitute financial advice, investment recommendation, or solicitation to buy or sell any digital assets. Cryptocurrency markets are highly volatile and involve substantial risk, including the potential loss of principal. Past performance is not indicative of future results. Technical indicators and analysis are based on historical data and may not predict future price movements. You should conduct your own research and consult with a qualified financial advisor before making any investment decisions. The author and platform assume no liability for any losses or damages arising from the use of this information.
FAQ
Q: Why is Bitcoin’s RSI at 31.0 considered oversold?
A: The Relative Strength Index (RSI) measures the speed and magnitude of recent price changes. A reading below 30 is typically considered oversold, indicating that the asset may be undervalued and due for a potential bounce. Bitcoin’s RSI of 31.0 is just above this threshold, suggesting selling pressure is extreme but not yet at a level that historically guarantees a reversal. It signals caution but also the possibility of a relief rally if buying interest returns.
Q: What does low trading volume (0.27x of the 7-day average) mean for Bitcoin?
A: Low volume relative to the average indicates reduced market participation. In a downtrend, low volume can suggest that selling pressure is diminishing, which may lead to a stabilization or bounce. However, it also means that any price move may lack conviction, and the market could be susceptible to sudden volatility if a catalyst emerges. It’s a neutral signal that requires confirmation from price action.
Q: How does Ethereum’s 12.85% monthly decline compare to Bitcoin’s?
A: Ethereum’s 30-day decline of 12.85% is significantly larger than Bitcoin’s 6.22% drop, indicating that ETH is underperforming BTC in the current bearish environment. This is common during risk-off periods, as investors often rotate into Bitcoin as a safer haven. The divergence suggests that ETH may be more vulnerable to further downside, but it could also offer higher upside potential in a recovery.
Q: What are the key support and resistance levels for BTC and ETH today?
A: For Bitcoin, the immediate support is at $72,512 (the 7-day low), with resistance at $74,637 (the 7-day moving average). For Ethereum, support is at $1,967 (the 7-day low), and resistance is at $2,040 (the 7-day moving average). A break below these supports could lead to further declines, while a move above resistances may signal a short-term trend reversal.
Q: What trading strategy is best suited for the current low-volatility market?
A: A grid trading strategy is well-suited for range-bound markets like today’s, as it profits from price oscillations between support and resistance. Dollar-cost averaging (DCA) is also appropriate for long-term investors looking to accumulate at lower prices. Pionex offers automated bots for both strategies, allowing traders to execute these approaches without constant monitoring. Trend-following strategies are less advisable due to low volume and lack of directional momentum.