BTC ETH Daily Recap – 2026-05-28: Oversold Territory Deepens as Selling Pressure Intensifies
BTC ETH Daily Recap – 2026-05-28: Oversold Territory Deepens as Selling Pressure Intensifies
Today at a Glance
The cryptocurrency market faced another day of pronounced selling pressure on May 28, 2026, with both Bitcoin and Ethereum extending their weekly losses into deeply oversold territory. Bitcoin (BTC) declined 2.35% over the past 24 hours, settling at $72,700 after touching an intraday low of $72,613, its lowest point in the trailing 30-day period. The asset’s Relative Strength Index (RSI) plummeted to 19.0, indicating extreme oversold conditions not seen in recent memory. Ethereum (ETH) fared worse on a relative basis, dropping 2.70% to $1,970, with its RSI reading of 17.8 reflecting even more severe selling exhaustion. Both assets now trade well below their 7-day and 30-day moving averages, with BTC’s MA7 at $75,680 and MA30 at $78,302, while ETH’s MA7 stands at $2,066 and MA30 at $2,215. Trading volumes for BTC were 1.16 times the 7-day average, suggesting elevated participation during the selloff, while ETH volumes remained near average at 0.94x. The current price action signals a market dominated by bearish momentum, with technical indicators flashing historically low readings that often precede reversal attempts, though no confirmation has emerged yet.
Bitcoin Analysis
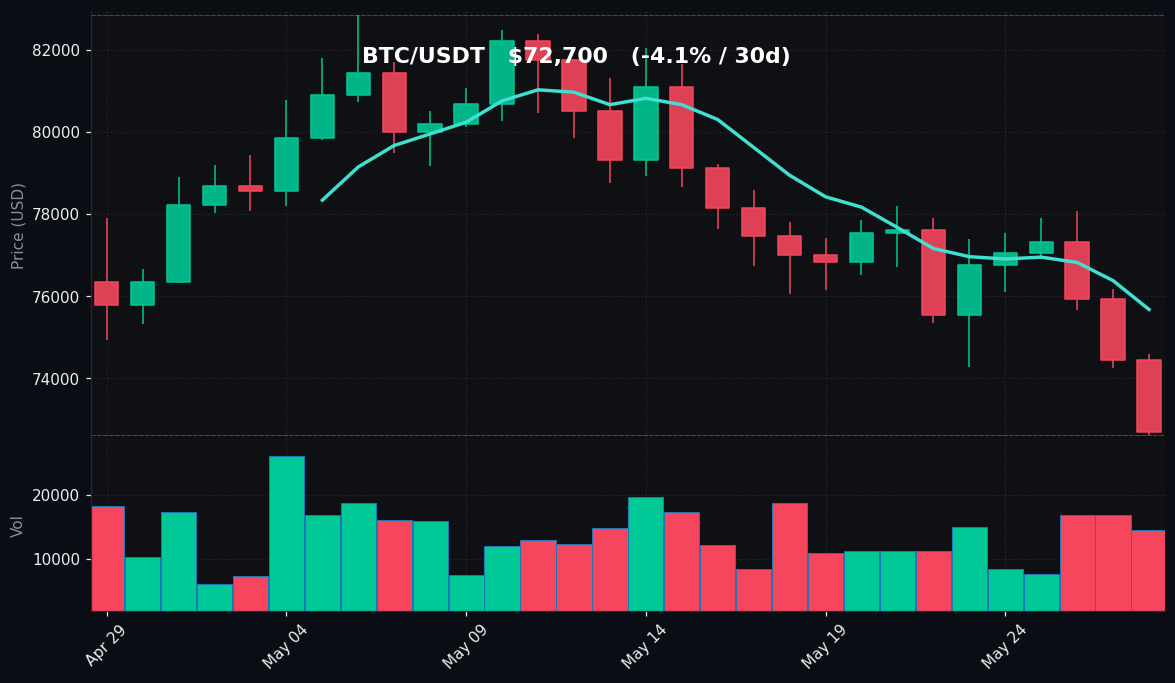
TradingView Live (4h)
Bitcoin’s technical landscape has deteriorated significantly over the past week, with the price breaking below key support levels and establishing a series of lower lows. The current price of $72,700 represents a 6.33% decline over the trailing seven days, with the weekly high of $78,080 now a distant memory. The 30-day performance is similarly negative at -4.06%, though the broader picture reveals that the asset has shed over $10,000 from its 30-day high of $82,850. The 24-hour trading range of $72,613 to $74,591 highlights the intraday volatility, with the low end marking the lowest point in both the 7-day and 30-day windows.
From a moving average perspective, Bitcoin is trading significantly below both its 7-day simple moving average (MA7) of $75,680 and its 30-day simple moving average (MA30) of $78,302. The spread between the current price and the MA30 is approximately 7.1%, indicating a steep discount that typically aligns with periods of panic selling or capitulation. The MA7 has now crossed below the MA30, a bearish signal that suggests near-term momentum is firmly in the hands of sellers. The 7-day high-to-low range of $5,467 (from $78,080 to $72,613) underscores the magnitude of the selloff, with the price failing to hold any meaningful support along the way.
Volume analysis reveals that trading activity has picked up relative to the 7-day average, with a volume ratio of 1.16x. This elevated volume during a price decline confirms that the selling pressure is genuine and not merely a function of low liquidity. However, the RSI reading of 19.0 is the most striking technical data point. An RSI below 30 is traditionally considered oversold, and a reading of 19.0 places Bitcoin in territory that has historically been associated with exhaustion of selling pressure. In previous instances where BTC’s RSI has dipped below 20, the asset has often staged short-term bounces or consolidation phases, though the duration and magnitude of such recoveries vary widely. The current RSI level suggests that sellers may be losing momentum, but no clear reversal signal has materialized yet. Key support levels to monitor include the $72,600 area (today’s low) and the psychological $70,000 round number. On the upside, resistance emerges at $74,600 (today’s high), followed by the MA7 at $75,680 and the more significant $78,000 zone.
Ethereum Analysis
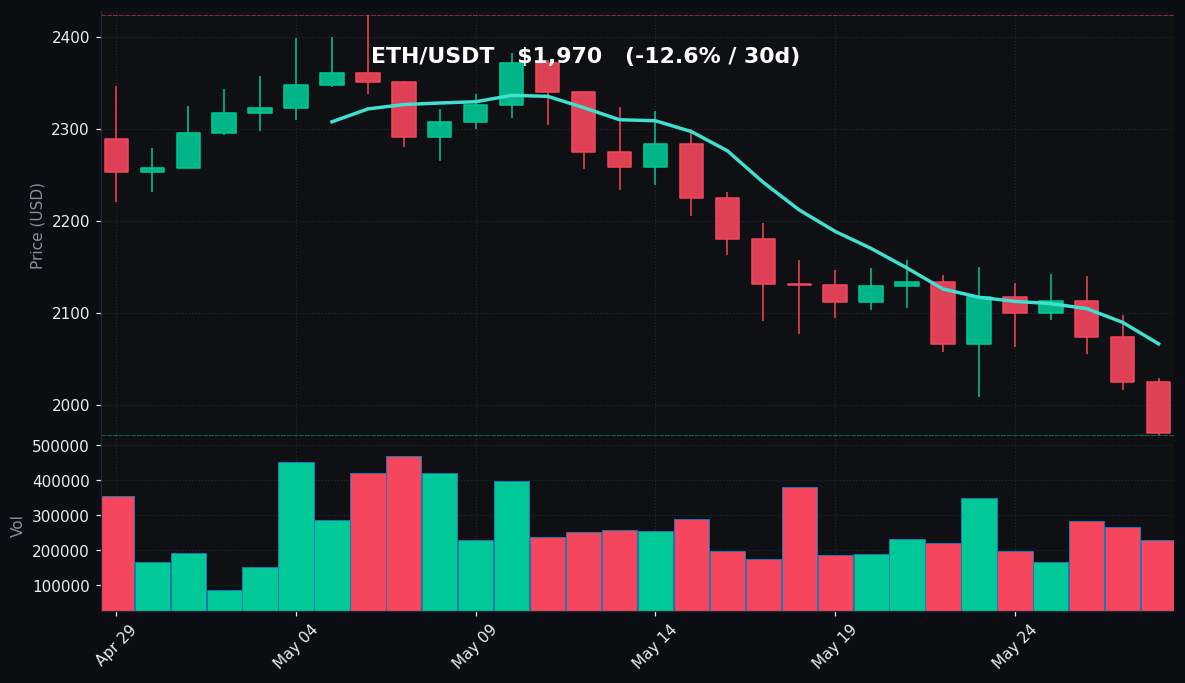
TradingView Live (4h)
Ethereum’s price action mirrors Bitcoin’s weakness but with even greater severity on both short-term and medium-term timeframes. The current price of $1,970 reflects a 2.70% decline over the past 24 hours, with the intraday range spanning from $1,967 to $2,029. The seven-day performance is notably worse than Bitcoin, with ETH losing 7.66% from its weekly high of $2,150. The 30-day picture is even more concerning, showing a 12.55% decline from the monthly high of $2,424 to the current level. This underperformance relative to Bitcoin is a recurring theme in the current market environment, as ETH has been unable to establish any meaningful support above the $2,000 psychological level.
From a moving average perspective, Ethereum is trading well below both its MA7 of $2,066 and its MA30 of $2,215. The gap between the current price and the MA30 is approximately 11.1%, a wider discount than Bitcoin’s, reflecting the deeper bearish sentiment surrounding the second-largest cryptocurrency. The MA7 has also crossed below the MA30, confirming the bearish alignment. The 7-day high-to-low range of $183 (from $2,150 to $1,967) is significant in percentage terms (8.5%), indicating heightened volatility during the selloff. The 30-day range of $457 (from $2,424 to $1,967) further emphasizes the magnitude of the decline.
Volume analysis shows that trading activity for ETH is slightly below the 7-day average, with a ratio of 0.94x. This suggests that while selling pressure is present, it is not accompanied by a surge in participation, which could indicate a lack of conviction among sellers or simply lower liquidity relative to the previous week. The RSI reading of 17.8 is even more extreme than Bitcoin’s, placing Ethereum in deeply oversold territory that has historically been associated with short-term capitulation bottoms. An RSI below 20 is rare for ETH and often precedes sharp reversals, though the timing and catalyst remain uncertain. Key support levels to watch include the $1,967 area (today’s low), the psychological $1,900 level, and the August 2024 low around $1,800. On the upside, resistance is found at $2,030 (today’s high), followed by the MA7 at $2,066 and the $2,150 weekly high.
Key Technical Levels
| Asset | Support | Resistance | RSI |
|---|---|---|---|
| BTC | $72,600 (current low), $70,000 (psychological) | $74,600 (daily high), $75,680 (MA7), $78,080 (weekly high) | Oversold (19.0) |
| ETH | $1,967 (current low), $1,900 (psychological) | $2,030 (daily high), $2,066 (MA7), $2,150 (weekly high) | Oversold (17.8) |
BTC vs ETH Dynamic
The correlation between Bitcoin and Ethereum remains high in the current market environment, with both assets moving in tandem during the selloff. However, Ethereum’s relative weakness is notable: over the past seven days, ETH has underperformed BTC by approximately 1.33 percentage points (7.66% vs. 6.33%), and over the past 30 days, the gap widens to 8.49 percentage points (12.55% vs. 4.06%). This divergence suggests that ETH is facing additional headwinds beyond the broader market downturn, possibly related to network-specific factors such as reduced on-chain activity, lower staking yields, or competition from alternative layer-1 blockchains. The ETH/BTC ratio has declined accordingly, reflecting a shift in investor preference toward Bitcoin as a relative safe haven within the crypto ecosystem. Historically, such periods of ETH underperformance have resolved either through a catch-up rally in ETH or further consolidation before a broader market recovery. The current RSI readings for both assets are at extreme lows, which could signal that the selling pressure is indiscriminate and may soon exhaust itself.
Strategy Fit
The current market environment, characterized by extreme oversold conditions, elevated volatility, and bearish momentum, calls for cautious and structured trading approaches. Given the RSI readings below 20 for both BTC and ETH, a grid trading strategy may be particularly well-suited for capturing potential mean reversion moves. Grid bots, such as those available on Pionex, can automatically place buy orders at lower price levels and sell orders at higher levels within a predefined range, profiting from the oscillations that often occur during consolidation phases following sharp declines. The current 24-hour ranges ($72,613-$74,591 for BTC and $1,967-$2,029 for ETH) provide a reasonable framework for setting grid parameters.
Alternatively, Dollar-Cost Averaging (DCA) into positions during these oversold levels could be a prudent approach for longer-term perspectives, as it reduces the risk of entering at the exact bottom while benefiting from lower average entry prices. Pionex’s DCA bot allows users to automate periodic purchases, smoothing out entry points over time. Trend-following strategies are less advisable at present, as the bearish trend is mature and the risk of a sudden reversal is elevated. For traders with a shorter time horizon, reversal trading near the identified support levels, with tight stop-losses, could capture potential bounces. Regardless of the strategy, position sizing should be conservative given the elevated volatility and the absence of a confirmed bottom.
Risk Disclaimer
This market recap is for informational and educational purposes only and does not constitute financial advice, investment recommendation, or solicitation to buy, sell, or hold any digital assets. Cryptocurrency markets are highly volatile and involve substantial risk, including the potential loss of principal. Past performance and technical indicators are not guarantees of future results. All trading decisions should be made based on your own independent research, risk tolerance, and financial situation. You should consult with a qualified financial advisor before engaging in any trading activities. The author and platform assume no liability for any losses incurred as a result of the information provided herein.
FAQ
Q: Why are BTC and ETH RSI readings so low (19.0 and 17.8)?
A: RSI (Relative Strength Index) measures the speed and magnitude of recent price changes. Readings below 30 are considered oversold, and values below 20 indicate extreme selling pressure. The current readings reflect a sustained period of price declines with relatively low buying interest, pushing the indicator into territory that historically has been associated with potential exhaustion of selling momentum.
Q: What does it mean when BTC trades below both its MA7 and MA30?
A: Trading below both the 7-day and 30-day moving averages indicates that the short-term and medium-term trends are bearish. The MA7 ($75,680) and MA30 ($78,302) are both above the current price ($72,700), suggesting that recent price action has been consistently lower than the average of the past week and month. This alignment is a classic bearish signal.
Q: Is this a good time to buy the dip?
A: Buying during oversold conditions can be tempting, but it carries significant risk because prices can remain oversold for extended periods or decline further. The RSI readings suggest selling pressure may be exhausting, but no reversal confirmation exists yet. A disciplined approach, such as DCA or waiting for price to reclaim key moving averages, may be more prudent than a single lump-sum purchase.
Q: How does the volume ratio of 1.16x for BTC and 0.94x for ETH affect the analysis?
A: Volume ratio compares current trading volume to the 7-day average. BTC’s 1.16x indicates that volume is 16% above average, confirming that the selloff is accompanied by active participation. ETH’s 0.94x suggests volume is slightly below average, which could mean selling pressure is less intense or that liquidity is lower. High volume during declines typically confirms bearish momentum, while low volume can signal a lack of conviction.
Q: What are the most important levels to watch for BTC and ETH in the coming days?
A: For BTC, the immediate support is $72,600 (today’s low), with a break below opening the door to $70,000. Resistance is at $74,600 (daily high), then $75,680 (MA7). For ETH, support is at $1,967 (today’s low) and $1,900, while resistance is at $2,030 (daily high) and $2,066 (MA7). A close above the MA7 for either asset would be an early sign of momentum shift.