BTC ETH Daily Recap – May 29, 2026
BTC ETH Daily Recap – May 29, 2026
Today at a Glance
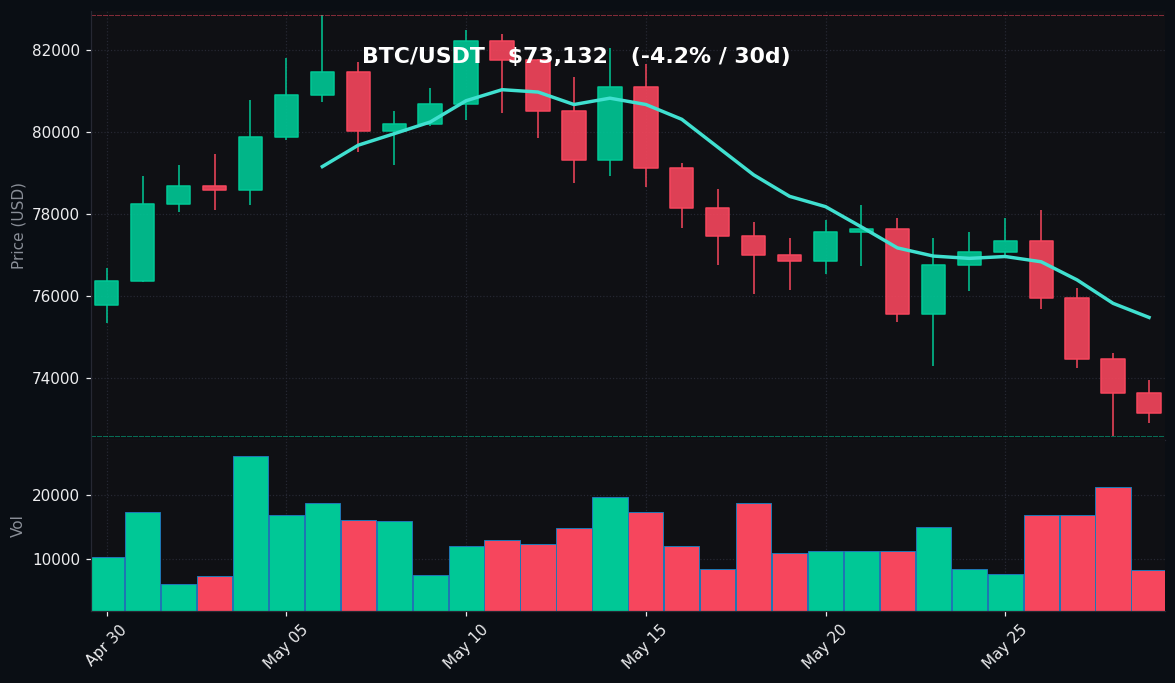
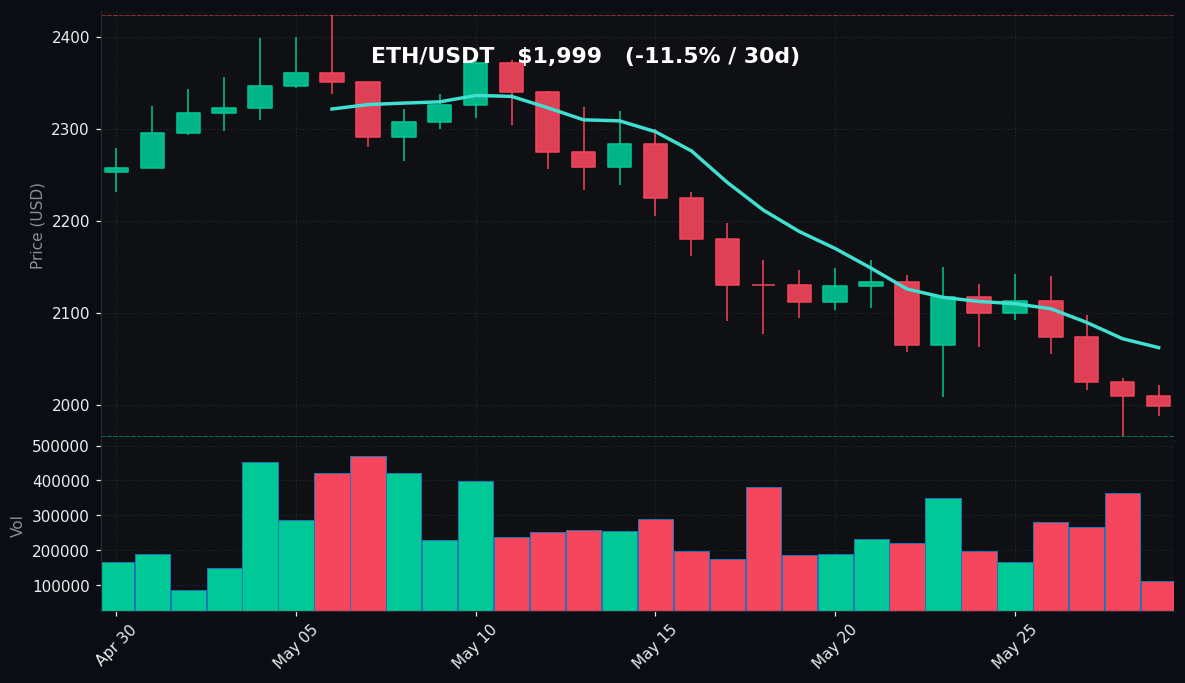
The crypto market continues to face selling pressure on May 29, 2026, with both Bitcoin and Ethereum posting minor declines over the past 24 hours. Bitcoin is trading at $73,132, down 0.66% for the day, while Ethereum sits at $1,999, a 0.56% loss. The weekly trends remain bearish, with BTC losing 3.19% and ETH shedding 3.26% over the past seven days. Notably, both assets are trading well below their 30-day moving averages, signaling sustained weakness. Bitcoin’s 30-day loss of 4.21% is relatively contained compared to Ethereum’s sharper 11.47% decline over the same period. RSI readings for both assets are deeply oversold—Bitcoin at 23.1 and Ethereum at 21.7—suggesting extreme bearish sentiment without immediate reversal signals. Trading volumes are significantly below their 7-day averages, with BTC at 0.6x and ETH at 0.42x, indicating reduced participation and potential exhaustion of selling momentum. The intraday ranges remain tight, with BTC oscillating between $72,900 and $73,939, and ETH between $1,988 and $2,022. The market is in a clear downtrend, characterized by lower highs and lower lows across both assets.
Bitcoin Analysis
TradingView Live (4h)
Bitcoin’s price action on May 29 reveals a market entrenched in a short-term downtrend. The current price of $73,132 sits below both the 7-day moving average of $75,467 and the 30-day moving average of $78,244, confirming bearish momentum across multiple timeframes. The gap between price and the 30-day MA is particularly wide at approximately $5,112, or 6.5%, highlighting the severity of the recent sell-off. The 7-day high of $78,080 and low of $72,583 illustrate a declining range, with each successive peak lower than the previous one.
Key technical levels to watch include immediate support at the 7-day low of $72,583, which has been tested multiple times this week. A breakdown below this level could open the door to further downside toward psychological support at $70,000. On the upside, resistance is first encountered at the 7-day MA of $75,467, followed by the more significant $78,080 level (7-day high). The 30-day MA at $78,244 represents a major resistance barrier that would require a substantial shift in sentiment to reclaim.
Volume analysis reveals a concerning picture. Current trading volume is at 0.6x the 7-day average, indicating that market participants are stepping back. This volume contraction during a downtrend can be interpreted in two ways: either selling pressure is exhausting, or buyers remain absent, unwilling to step in at current levels. The lack of volume suggests the latter is more likely, as a capitulation event would typically see volume spikes.
The RSI(14) reading of 23.1 is deeply oversold, below the 30 threshold that traditionally signals extreme bearish conditions. Historically, such levels have preceded short-term bounces, but they can also persist in strong downtrends. The RSI has been declining steadily over the past week, from neutral territory above 50 to current oversold levels, indicating accelerating downside momentum. Without a catalyst, the path of least resistance remains lower, though the oversold condition warrants attention for potential mean reversion.
Ethereum Analysis
TradingView Live (4h)
Ethereum’s performance on May 29 mirrors Bitcoin’s weakness but with greater severity over the longer timeframe. At $1,999, ETH has lost 11.47% over the past 30 days, nearly three times Bitcoin’s decline, reflecting higher beta and greater sensitivity to market downturns. The price is firmly below both the 7-day MA of $2,063 and the 30-day MA of $2,208, with the gap to the 30-day MA reaching $209, or 10.5%, indicating a more pronounced bearish structure than Bitcoin.
The 7-day range of $1,967 to $2,150 shows a clear pattern of lower highs, with each attempt to rally failing below the previous week’s high. The current price near $2,000 is testing psychological support, having bounced from the 7-day low of $1,967. Key support levels include the $1,967 area, which represents the recent swing low, and the psychological $1,900 level below that. Resistance is first at the 7-day MA of $2,063, then at $2,150 (7-day high), and finally the 30-day MA at $2,208.
Volume analysis for Ethereum is even more concerning than Bitcoin’s. At 0.42x the 7-day average, trading activity has dropped to less than half of normal levels. This extreme volume contraction during a downtrend suggests a lack of conviction among both buyers and sellers. The market appears to be in a state of drift, with low liquidity amplifying price swings and making technical levels less reliable.
The RSI(14) at 21.7 is deeply oversold, even more so than Bitcoin’s. This reading indicates that Ethereum has been sold off aggressively and is now at levels that have historically preceded at least temporary bounces. However, the persistent downtrend and weak volume suggest that any bounce may be short-lived unless accompanied by a significant increase in buying activity. The divergence between the RSI and price—with RSI at extreme lows but price continuing to make new lows—is a bearish signal that indicates strong downward momentum.
Key Technical Levels
| Asset | Support | Resistance | RSI |
|---|---|---|---|
| BTC | $72,583 | $75,467 | Oversold (23.1) |
| ETH | $1,967 | $2,063 | Oversold (21.7) |
BTC vs ETH Dynamic
The correlation between Bitcoin and Ethereum remains high, with both assets moving in tandem over the past 24 hours and week. However, Ethereum’s 30-day decline of 11.47% compared to Bitcoin’s 4.21% loss highlights a divergence in relative strength. Bitcoin is acting as the relative safe haven within the crypto space, losing less value during the sell-off. This dynamic is typical during bearish phases, where capital rotates from higher-beta assets like Ethereum into Bitcoin. The ETH/BTC ratio has been declining, indicating that Bitcoin is outperforming Ethereum on a relative basis. The volume differential is also notable—Bitcoin’s volume at 0.6x average versus Ethereum’s 0.42x suggests that Bitcoin retains more market interest and liquidity. Should a market recovery occur, Ethereum’s oversold condition and deeper decline could lead to a sharper rebound, but current momentum favors Bitcoin’s relative stability.
Strategy Fit
Given the current market conditions of low volume, oversold RSI readings, and persistent downtrends, a one-size-fits-all approach is not advisable. The low volatility environment, with BTC’s 24h range of just 1.4% and ETH’s 1.7%, makes trend-following strategies less effective as breakouts lack conviction. Instead, a grid trading strategy is well-suited for this sideways-to-slightly-downward movement. Pionex’s built-in grid trading bots can capitalize on the tight intraday ranges by buying low and selling high within defined price boundaries. For Bitcoin, a grid between $72,000 and $75,500 would capture the current oscillation. For Ethereum, a grid between $1,950 and $2,100 could be effective.
Dollar-cost averaging (DCA) is another appropriate strategy given the oversold conditions. Accumulating positions at these depressed levels, particularly for Ethereum which has seen a steeper decline, can lower average entry prices over time. Pionex’s DCA bots automate this process, buying at regular intervals or on price dips. Trend-following strategies should be avoided until a clear reversal pattern emerges, such as a break above the 7-day moving averages with increasing volume. The current environment favors patience and systematic accumulation over aggressive directional bets.
Risk Disclaimer
This market recap is for informational and educational purposes only and does not constitute financial advice, investment recommendation, or solicitation to buy or sell any digital assets. Cryptocurrency markets are highly volatile and involve substantial risk of loss. Past performance and technical indicators are not guarantees of future results. Always conduct your own research and consult with a qualified financial advisor before making investment decisions. The technical levels and strategies discussed are based on historical data and may not hold under current market conditions. Trading cryptocurrencies may not be suitable for all investors, and you should never invest more than you can afford to lose.
FAQ
Q: Why are both BTC and ETH RSI readings so low?
A: The RSI(14) for BTC at 23.1 and ETH at 21.7 indicates both assets are deeply oversold after a sustained sell-off over the past week and month. This reflects aggressive selling pressure and bearish sentiment, with prices falling below key moving averages. Oversold conditions can persist in strong downtrends but historically have preceded short-term bounces.
Q: What does the low trading volume suggest?
A: Current volume at 0.6x (BTC) and 0.42x (ETH) of the 7-day average indicates reduced market participation. This suggests that the sell-off may be exhausting as fewer sellers remain, but also that buyers are not stepping in aggressively. Low volume can lead to increased volatility on any news or large orders.
Q: How do the support and resistance levels work?
A: Support levels represent price points where buying interest may emerge to prevent further decline. Resistance levels are where selling pressure may increase. For BTC, $72,583 (7-day low) is immediate support, while $75,467 (7-day MA) is resistance. For ETH, $1,967 (7-day low) is support, and $2,063 (7-day MA) is resistance. These levels are based on recent price action and may shift.
Q: Is Ethereum underperforming Bitcoin?
A: Yes, over the past 30 days, Ethereum has declined 11.47% compared to Bitcoin’s 4.21% loss. This is typical during market downturns as investors rotate into Bitcoin as a relative safe haven. Ethereum’s higher beta means it tends to fall more in bearish phases and could rise more in recoveries.
Q: What trading strategies are suitable for this market?
A: Grid trading and DCA are most suitable given the low volatility and oversold conditions. Grid bots can profit from tight ranges, while DCA bots accumulate at lower prices. Trend-following strategies are not recommended until a clear breakout above moving averages with volume confirmation occurs. Always use proper risk management.