BTC ETH Daily Recap — June 14, 2026
BTC ETH Daily Recap — June 14, 2026
Today at a Glance
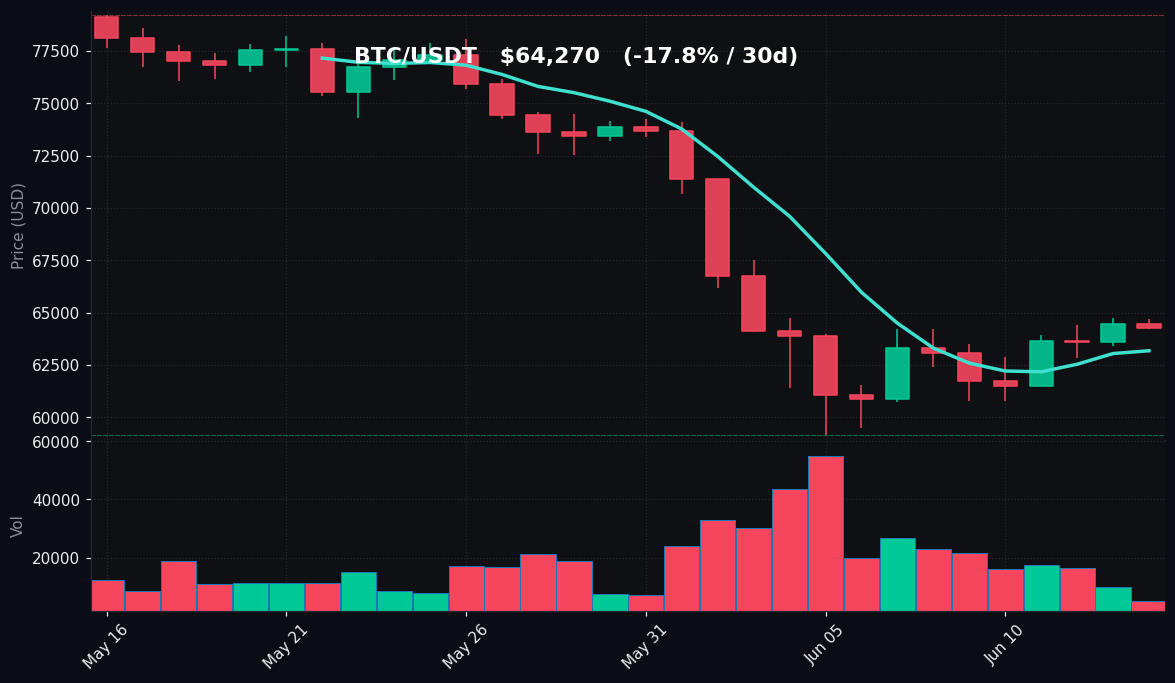
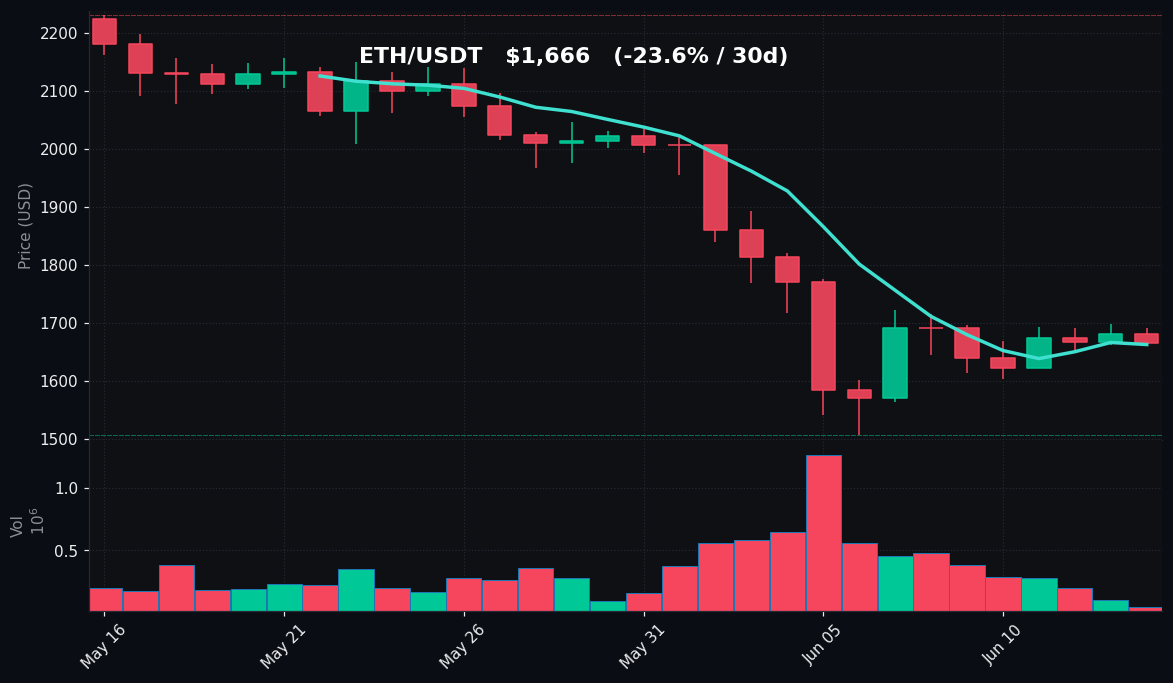
The cryptocurrency market showed muted action on June 14, 2026, with Bitcoin and Ethereum both consolidating near key support zones. Bitcoin edged down 0.29% over the past 24 hours, trading at $64,270, after touching a daily high of $64,710 and a low of $64,214. The asset’s 7-day performance remains positive at +1.48%, but the 30-day trend is decisively bearish at -17.76%. Ethereum underperformed Bitcoin, declining 0.93% in the last day to $1,666, with a 7-day loss of 1.48% and a sharp 30-day drop of 23.63%. Both assets are trading below their 30-day moving averages, with RSI readings deep in oversold territory—26.8 for BTC and 26.2 for ETH. Trading volumes are significantly below 7-day averages, suggesting low participation and a lack of directional conviction. The market remains in a cautious consolidation phase, with sellers dominating the medium-term picture while short-term bounces attempt to stabilize.
Bitcoin Analysis
TradingView Live (4h)
Bitcoin is currently trading at $64,270, near the lower end of its 24-hour range of $64,214 to $64,710. The asset’s 7-day trajectory shows a modest recovery from a weekly low of $60,755 to a high of $64,763, representing a 6.6% rebound from the trough. However, the broader 30-day picture remains challenging, with BTC down 17.76% from a high of $79,228 and a low of $59,131. The current price sits below the 30-day moving average of $70,335 by approximately 8.6%, indicating sustained bearish pressure. The 7-day moving average at $63,180 provides a near-term floor, as BTC has traded above this level for the past two sessions.
Technically, the RSI(14) reading of 26.8 places Bitcoin firmly in oversold territory, a condition that historically has preceded short-term bounces or consolidation. However, the volume profile is concerning—current trading volume is only 0.27 times the 7-day average, confirming low participation. This suggests that the oversold RSI may not trigger an immediate reversal, as weak volume often precedes continued sideways movement or further declines. Key support levels to watch include the $60,755 weekly low and the $59,131 30-day low. On the upside, resistance is evident at the 7-day moving average of $63,180, which BTC has cleared, and more firmly at the 30-day MA of $70,335. The price action indicates a market waiting for a catalyst, with neither buyers nor sellers showing conviction. The low volume environment amplifies the risk of sudden volatility, though the current pattern suggests a range-bound market between $60,000 and $65,000 in the near term.
Ethereum Analysis
TradingView Live (4h)
Ethereum is trading at $1,666, down 0.93% in the last 24 hours, with a daily range of $1,664 to $1,690. The 7-day performance shows a decline of 1.48%, with a weekly high of $1,714 and a low of $1,603. The 30-day trend is notably weaker than Bitcoin’s, with ETH falling 23.63% from a high of $2,232 to a low of $1,506. The current price is below both its 7-day moving average of $1,663 and its 30-day moving average of $1,910, the latter by approximately 12.8%. This indicates that Ethereum has been underperforming Bitcoin in both the short and medium term, with sellers maintaining control.
The RSI(14) for Ethereum stands at 26.2, also in oversold territory and slightly lower than Bitcoin’s reading. This suggests that ETH has experienced more pronounced selling pressure relative to its recent price history. Volume is extremely thin, at only 0.16 times the 7-day average, the lowest relative reading among major assets. This lack of participation amplifies the risk of sharp moves, as thin order books can lead to exaggerated price swings. Key support levels are the $1,603 weekly low and the $1,506 30-day low. On the resistance side, the 7-day MA at $1,663 is acting as immediate overhead, with stronger resistance at the $1,714 weekly high and the 30-day MA at $1,910. The price action shows ETH attempting to stabilize near $1,660, but the low volume and weak relative strength suggest that any upside may be limited until broader market sentiment improves. The divergence between BTC’s modest weekly gain and ETH’s weekly loss highlights Ethereum’s relative weakness in the current environment.
Key Technical Levels
| Asset | Support | Resistance | RSI |
|---|---|---|---|
| BTC | $60,755 (weekly low), $59,131 (30-day low) | $63,180 (MA7), $70,335 (MA30) | Oversold (26.8) |
| ETH | $1,603 (weekly low), $1,506 (30-day low) | $1,663 (MA7), $1,714 (weekly high), $1,910 (MA30) | Oversold (26.2) |
BTC vs ETH Dynamic
The correlation between Bitcoin and Ethereum remains high, but the relative performance gap has widened. Over the past 7 days, BTC has gained 1.48% while ETH has lost 1.48%, a divergence of nearly 3 percentage points. On a 30-day basis, BTC’s decline of 17.76% is less severe than ETH’s 23.63% drop, indicating that Ethereum is bearing the brunt of selling pressure. This is consistent with historical patterns where ETH tends to underperform BTC during broad market corrections, as traders rotate into the more liquid and perceived safer Bitcoin. The RSI readings are nearly identical (26.8 vs 26.2), suggesting that both assets are experiencing similar oversold conditions, but the volume differential (BTC at 0.27x vs ETH at 0.16x) indicates even lower conviction in Ethereum. If a relief rally materializes, ETH may have more upside potential due to its deeper oversold condition, but the low volume suggests that any recovery will require a catalyst. The current dynamic favors Bitcoin as the relative strength leader, with Ethereum acting as a laggard.
Strategy Fit
Given the current market conditions—low volume, oversold RSI readings, and prices below key moving averages—the environment is best suited for range-bound and accumulation strategies. Volatility is compressed, as evidenced by the narrow daily ranges and low volume relative to averages. For traders seeking to capitalize on the current consolidation, a grid trading bot is well-suited. With BTC trading between $60,755 and $64,763 over the past week, a grid strategy can profit from small price oscillations within this range. Pionex’s built-in grid trading bots allow users to set upper and lower price limits and automatically execute buy-low-sell-high orders. Given the oversold RSI, a DCA (Dollar-Cost Averaging) bot is also appropriate for long-term accumulators. The current price near the lower end of the 30-day range provides an attractive entry point for gradual accumulation. Trend-following strategies are less suitable at this time, as the market lacks a clear directional trend—BTC and ETH are neither in a confirmed uptrend nor a breakdown phase. A neutral-to-bearish bias is warranted, but the oversold conditions argue against aggressive shorting. For conservative participants, waiting for a volume expansion or a break above the 30-day moving averages would confirm a trend shift. Pionex’s infinity grid and rebalancing bots can also be used to manage risk in this low-volatility environment, allowing for automated adjustments as market conditions evolve.
Risk Disclaimer
This market recap is for informational and educational purposes only and does not constitute financial advice, investment recommendation, or solicitation to buy or sell any digital assets. Cryptocurrency trading involves substantial risk, including the potential for total loss of capital. Past performance and technical indicators are not guarantees of future results. Market conditions can change rapidly, and readers should conduct their own research and consult with a qualified financial advisor before making any trading decisions. The data presented is based on publicly available information and may contain errors or omissions. The author and Pionex assume no liability for any losses incurred from the use of this information.
FAQ
Q: Why is Bitcoin’s RSI at 26.8 considered oversold?
An RSI below 30 is typically interpreted as oversold, meaning the asset has experienced a significant price decline relative to its recent gains. It suggests that selling pressure may be exhausted, but it does not guarantee a reversal—prices can remain oversold for extended periods, especially in low-volume environments.
Q: What does low trading volume (0.27x for BTC) indicate?
Low volume relative to the 7-day average suggests reduced market participation and liquidity. This can lead to increased price sensitivity to large orders, potential for sudden spikes or drops, and less reliable technical signals. It often precedes consolidation or a breakout when volume eventually returns.
Q: How do the 7-day and 30-day moving averages affect trading decisions?
The MA7 acts as short-term support or resistance, while the MA30 indicates the medium-term trend. When price is below both, the trend is bearish. A break above the MA30 is often seen as a bullish signal. In the current case, BTC and ETH are below their MA30, suggesting ongoing bearish pressure.
Q: Why is Ethereum underperforming Bitcoin in this market?
Ethereum tends to have higher beta (volatility) relative to Bitcoin. During risk-off periods, traders often rotate from altcoins into Bitcoin, which is perceived as a safer store of value. Additionally, ETH’s larger percentage decline from its 30-day high reflects its higher sensitivity to market sentiment.
Q: What trading strategies are most appropriate in a low-volume, oversold market?
Grid trading and DCA are most suitable. Grid trading profits from small price ranges, while DCA allows for gradual accumulation at lower prices. Trend-following strategies are less effective due to lack of direction. Always use stop-losses and position sizing to manage risk in such environments.