BTC ETH Daily Recap — June 27, 2026

BTC ETH Daily Recap — June 27, 2026
Today at a Glance
The crypto market saw a modest recovery on June 27, 2026, with both Bitcoin and Ethereum posting marginal gains after a week of sustained selling pressure. Bitcoin (BTC) traded at $60,516, up 0.70% over the past 24 hours, recovering from a low of $59,876 but still down 5.88% over the last seven days. Ethereum (ETH) mirrored BTC's move, rising 0.71% to $1,590, though its 7-day decline deepened to -8.68%. Volume remains exceptionally low — BTC’s 24-hour volume is just 0.29x its 7-day average, while ETH’s is 0.21x — suggesting cautious positioning ahead of the weekend. The Relative Strength Index (RSI) for both assets remains in bearish territory: BTC at 35.1 (approaching oversold) and ETH at 40.3 (neutral-bearish). Short-term moving averages continue to slope downward, with BTC’s MA7 ($61,650) below its MA30 ($64,503), confirming a bearish cross that has persisted for several weeks.
Bitcoin Analysis
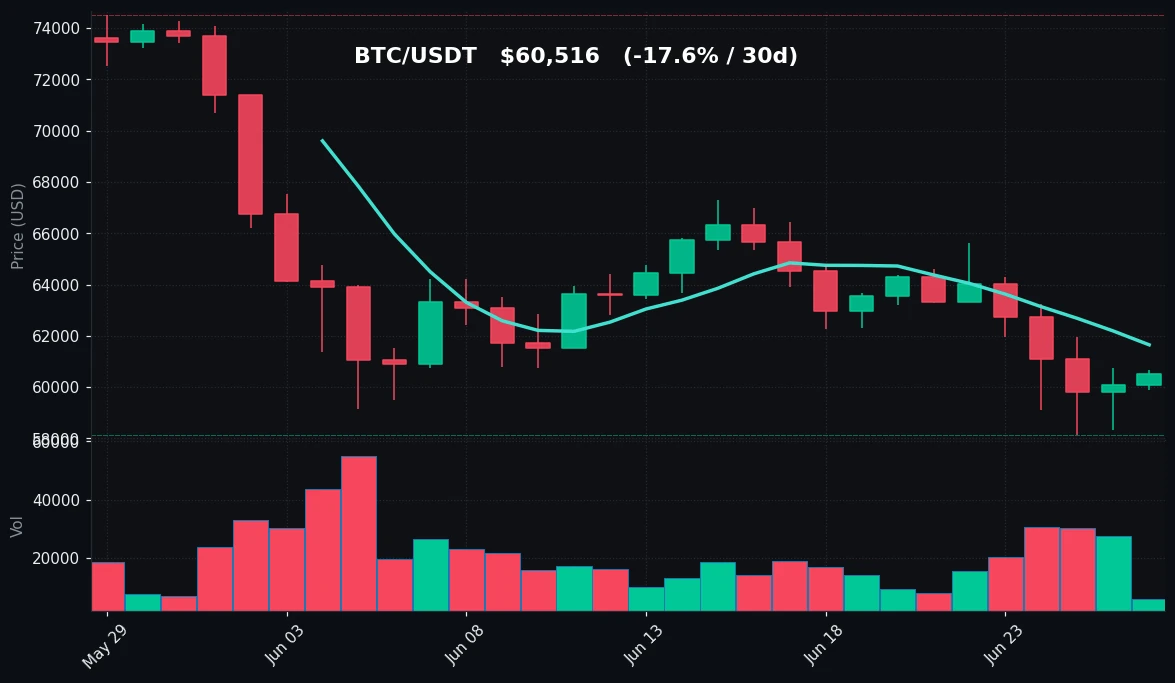
TradingView Live (4h)
Bitcoin’s price action on June 27 reflects a market caught between short-term stabilization and persistent bearish momentum. The daily candle opened near $60,100 and climbed to a high of $60,666 before settling at $60,516 — a tight intraday range of just $790, which underscores low volatility and indecision. The 24-hour gain of 0.70% is marginal, but it marks the first positive daily close after three consecutive days of declines. However, the broader picture remains fragile: Bitcoin is down 5.88% over the past week and 17.62% over the past 30 days, with the 30-day high of $74,514 (set in late May) now a distant memory.
Key technical levels are crystallizing. The 7-day moving average (MA7) at $61,650 acts as immediate resistance, while the 30-day moving average (MA30) at $64,503 represents a stronger overhead barrier. Bitcoin has traded below both MAs since June 15, and the MA7/MA30 bearish cross — confirmed on June 12 — remains intact. The RSI(14) at 35.1 is approaching the oversold threshold of 30, a zone that historically has attracted buyers. However, the RSI has not yet signaled a reversal; it has been declining steadily from 48 on June 20, indicating persistent selling pressure without exhaustion.
Volume is a critical concern. The 24-hour volume is only 0.29x the 7-day average, suggesting that the current price level is not attracting significant participation. This low volume rally is typical of a dead-cat bounce or short-covering rather than genuine accumulation. The intraday low of $59,876 tested the psychological $60,000 support, which held, but the 7-day low of $58,115 (reached on June 23) remains a key downside target. If BTC fails to hold above $60,000, a retest of the $58,000-$58,100 zone is likely.
From a structural perspective, Bitcoin is forming a descending channel on the daily chart, with lower highs since the $74,514 peak. The $58,115 low represents a potential double-bottom if supported by volume, but the current low-volume environment weakens that case. The market is in a wait-and-see mode, with traders monitoring macroeconomic cues and potential catalyst events. Without a volume catalyst, BTC may continue to drift lower or consolidate in a narrow range.
Ethereum Analysis
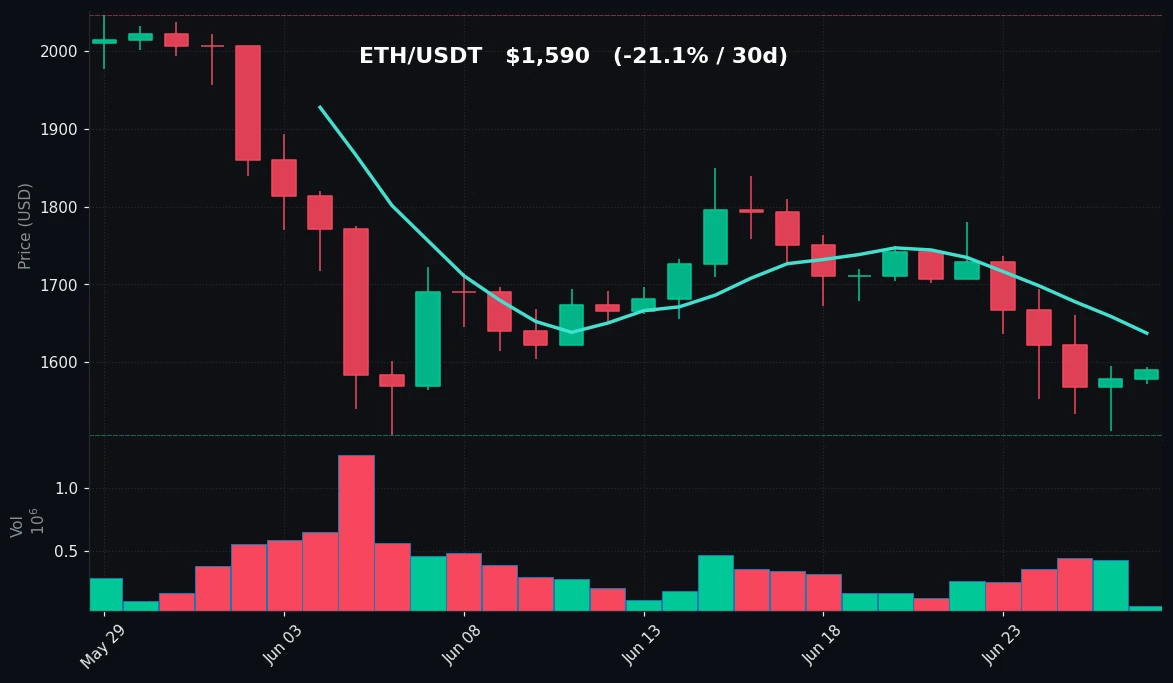
TradingView Live (4h)
Ethereum’s performance on June 27 closely tracked Bitcoin, rising 0.71% to $1,590, with a tight intraday range of $1,572 to $1,593. The 24-hour gain is essentially flat, and the asset remains deep in bearish territory: down 8.68% over the past week and 21.08% over the past 30 days. The 30-day high of $2,047 (May 28) is now 22.3% above current prices, highlighting the severity of the recent selloff. ETH’s 7-day low of $1,512 (June 23) is just 4.9% below today’s close, meaning the asset is still hovering near its recent bottom.
Technical indicators for ETH are slightly less bearish than BTC on the RSI front. The RSI(14) at 40.3 is in neutral territory, above the oversold threshold, and has actually risen from 34 on June 23. This suggests that selling momentum is easing, though it is not yet reversing. The MA7 at $1,637 and MA30 at $1,733 both slope downward, with ETH trading below both. The MA7/MA30 bearish cross occurred on June 11, and the gap between the two averages is widening, indicating accelerating bearish momentum.
Volume is extremely thin. The 24-hour volume is just 0.21x the 7-day average, the lowest relative reading in the past two weeks. This lack of participation means that even small buy or sell orders can have outsized price impacts, increasing the risk of sudden moves. The intraday high of $1,593 failed to break above the $1,600 psychological resistance, which has acted as a ceiling since June 24. On the downside, the $1,572 low held above the June 23 low of $1,512, suggesting a potential support zone between $1,500 and $1,520.
Ethereum’s structure is similar to Bitcoin’s: a descending channel from the $2,047 high, with lower highs and lower lows. The $1,512 low is a critical level — a break below could accelerate selling toward $1,400, while a bounce above $1,600 would be the first sign of stabilization. The lack of volume, however, makes both scenarios equally plausible. ETH’s correlation with BTC remains high (0.92 over the past 30 days), meaning any directional move in BTC will likely drive ETH in the same direction.
Key Technical Levels
| Asset | Support | Resistance | RSI |
|---|---|---|---|
| BTC | $58,115 (7d low) / $60,000 (psychological) | $61,650 (MA7) / $64,503 (MA30) | 35.1 — approaching oversold |
| ETH | $1,512 (7d low) / $1,500 (psychological) | $1,600 (psychological) / $1,637 (MA7) | 40.3 — neutral-bearish |
BTC vs ETH Dynamic
The correlation between Bitcoin and Ethereum remains strong, with both assets moving in near-perfect lockstep over the past 24 hours. BTC’s 0.70% gain and ETH’s 0.71% gain are virtually identical, reflecting the market’s tendency to treat both as a single risk-on asset class. However, there is a subtle divergence in relative strength: ETH’s RSI at 40.3 is notably higher than BTC’s 35.1, suggesting that ETH may be closer to a short-term bottom. ETH has also underperformed BTC over the past 30 days (-21.08% vs -17.62%), which could make it more attractive for mean-reversion traders. But the low volume environment means that any divergence is likely to be short-lived until a catalyst emerges. The ETH/BTC ratio currently stands at 0.0263, near its 30-day low of 0.0259, indicating that BTC is marginally outperforming ETH in the current downtrend.
Strategy Fit
Given the current market conditions — low volume, declining momentum, and RSI approaching oversold — the most suitable strategies are those that capitalize on range-bound movement and avoid directional bets. Grid trading is particularly well-suited for the current environment, as BTC and ETH are both trading in narrow ranges near support levels. A grid bot set between $58,000 and $62,000 for BTC, or $1,500 and $1,650 for ETH, would allow traders to profit from small intraday fluctuations without predicting a breakout direction. Pionex’s built-in grid trading bot can automate this process, placing buy orders near support and sell orders near resistance.
For traders with a lower risk tolerance, Dollar-Cost Averaging (DCA) into a spot position is a viable strategy. With BTC down 17.62% over 30 days and RSI near oversold, the risk-reward for long-term accumulation is improving. Pionex’s DCA bot allows users to set recurring buys at fixed intervals, reducing the impact of short-term volatility. However, given the lack of a clear reversal signal, DCA should be approached with a long-term horizon.
Trend-following strategies are not recommended at this time. The descending channel and bearish moving average cross suggest that any trend trades would be short-lived and prone to whipsaws. The low volume also increases the risk of false breakouts. A more prudent approach is to wait for a volume-backed move above MA7 ($61,650 for BTC) or a clear RSI oversold bounce before considering trend entries. Pionex’s smart trade features can be used to set stop-loss and take-profit orders to manage risk in this uncertain environment.
Risk Disclaimer
This market recap is for informational and educational purposes only. It does not constitute financial advice, investment recommendations, or solicitation to buy or sell any digital assets. Cryptocurrency markets are highly volatile and involve substantial risk of loss. Past performance is not indicative of future results. Always conduct your own research (DYOR) and consult with a qualified financial advisor before making any investment decisions. The technical levels and strategies discussed are based on current market data and may change without notice. Trading bots, including those offered by Pionex, do not guarantee profits and can result in losses.
FAQ
Q: Why is Bitcoin’s volume so low compared to its 7-day average?
A: Low volume typically indicates reduced market participation, often due to uncertainty or a lack of catalysts. On June 27, volume was 0.29x the 7-day average, suggesting traders are waiting for clearer signals before committing capital. This can lead to increased volatility if a large order moves the market.
Q: What does an RSI of 35.1 mean for Bitcoin?
A: RSI (Relative Strength Index) below 30 is considered oversold. At 35.1, BTC is approaching but not yet in oversold territory. This suggests selling pressure is strong but may be exhausting. Historically, oversold conditions can precede a bounce, but they are not guaranteed.
Q: Is the MA7/MA30 bearish cross a reliable signal?
A: The MA7/MA30 bearish cross occurs when the short-term moving average falls below the long-term average, indicating bearish momentum. It is a lagging indicator and works best in trending markets. In low-volume, range-bound conditions, it can produce false signals.
Q: How does Ethereum’s RSI compare to Bitcoin’s?
A: ETH’s RSI(14) is 40.3, which is higher than BTC’s 35.1. This means ETH is less oversold on a relative basis. However, ETH has underperformed BTC over the past 30 days (-21.08% vs -17.62%), so its higher RSI may reflect a slower decline rather than genuine strength.
Q: What is the best trading strategy for this market?
A: In a low-volume, range-bound market with bearish momentum, grid trading is often the most suitable strategy. It profits from small price fluctuations within a defined range. DCA is also viable for long-term accumulation. Trend-following strategies carry higher risk due to the lack of clear direction.


