BTC ETH Daily Recap — June 17, 2026
BTC ETH Daily Recap — June 17, 2026
Today at a Glance
On June 17, 2026, the crypto market saw modest declines as Bitcoin and Ethereum both retreated from their weekly highs. Bitcoin traded at $65,200, down 0.72% over the past 24 hours, after touching a daily high of $66,200 and a low of $64,565. The asset remains up 6.00% over the trailing seven days, though it is still 15.14% lower over the past 30 days. Ethereum fell more sharply, losing 1.88% to trade at $1,759, with a daily range of $1,810 to $1,743. Ethereum’s seven-day performance is stronger at +8.49%, but its 30-day decline of 16.70% is steeper than Bitcoin’s. Trading volumes for both assets are significantly below their seven-day averages — Bitcoin at 0.61x and Ethereum at 0.50x — suggesting cautious market participation. The RSI for Bitcoin sits at 53.9 (neutral), while Ethereum’s RSI of 45.9 leans slightly bearish, indicating a divergence in short-term momentum between the two largest cryptocurrencies.
Bitcoin Analysis
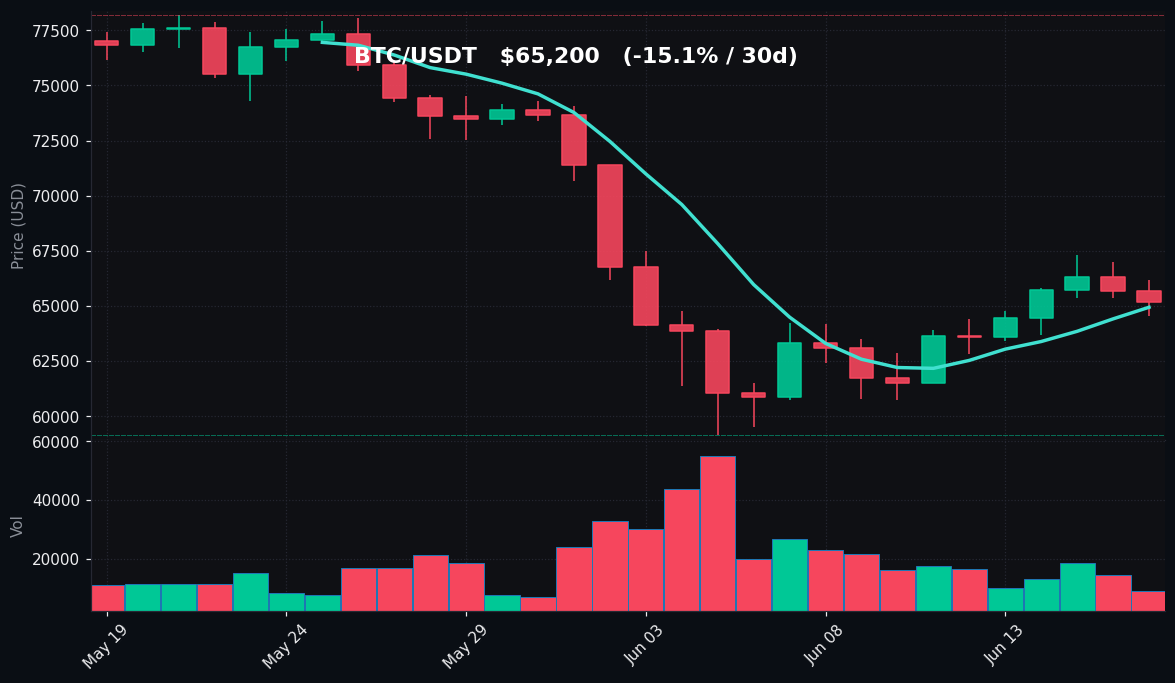
TradingView Live (4h)
Bitcoin’s price action on June 17 reflects a consolidation phase following a strong weekly rally. The asset’s seven-day high of $67,292, reached earlier in the week, marks a clear resistance level, while the weekly low of $61,511 provides a solid support floor. The current price of $65,200 sits above the seven-day moving average (MA7) of $64,945, indicating that short-term momentum remains slightly positive. However, it remains well below the 30-day moving average (MA30) of $69,204, confirming that the broader trend over the past month remains bearish. The distance between the MA7 and MA30 — approximately $4,259 — reflects a steep downward slope in the longer-term average, suggesting that the recent seven-day rally has not yet reversed the monthly downtrend.
The Relative Strength Index (RSI) at 53.9 places Bitcoin in neutral territory, neither overbought nor oversold. This level typically indicates room for movement in either direction without immediate exhaustion. The volume comparison to the seven-day average (0.61x) is notably low, implying that the current price action is driven by lower-than-usual participation. This can be interpreted as a lack of conviction among buyers and sellers, often preceding a breakout or breakdown once volume picks up. Key technical levels to watch include the $67,292 weekly high as resistance and the $64,565 daily low as near-term support. A break above the weekly high could target the $69,204 MA30, while a drop below $64,565 may test the $61,511 weekly low. The 30-day low of $59,131 remains a critical longer-term support level.
Ethereum Analysis
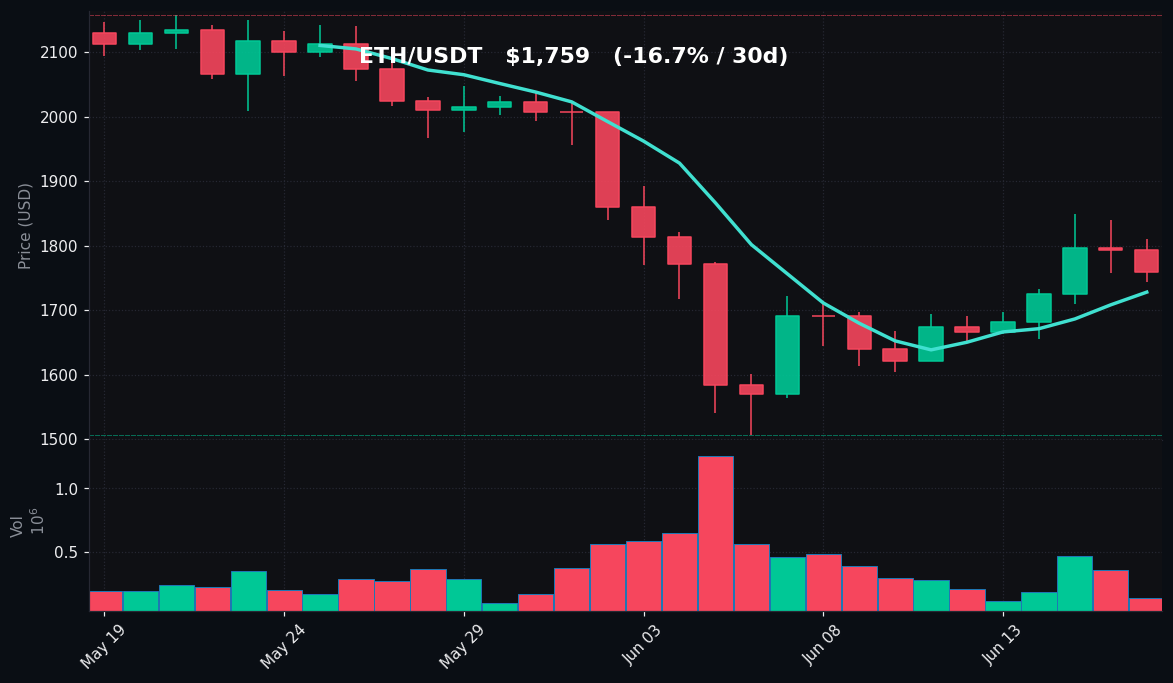
TradingView Live (4h)
Ethereum’s performance on June 17 shows a sharper decline than Bitcoin, losing 1.88% in the last 24 hours. The daily high of $1,810 was rejected, and the price settled near the low of $1,743. Over the past seven days, Ethereum has rallied 8.49%, with a weekly high of $1,850 and a low of $1,622. The current price of $1,759 sits above the MA7 of $1,728, indicating short-term bullish momentum within the week. However, the MA30 at $1,875 remains above the current price, signaling that the monthly trend is still negative. The gap between the MA7 and MA30 is $147, narrower than Bitcoin’s spread, but still indicative of a bearish medium-term structure.
The RSI for Ethereum is 45.9, which is below the neutral 50 level and leans toward oversold conditions. This suggests that selling pressure has been more persistent than buying interest, though the indicator is not yet in extreme oversold territory (typically below 30). Volume is notably low at 0.5x the seven-day average, confirming reduced trader activity. The daily low of $1,743 provides immediate support, with the weekly low of $1,622 as the next major floor. Resistance levels include the daily high of $1,810 and the weekly high of $1,850. The 30-day low of $1,506 and high of $2,158 define the broader range. Ethereum’s underperformance relative to Bitcoin in the daily timeframe, combined with its lower RSI, suggests it may be more vulnerable to further downside if market sentiment weakens.
Key Technical Levels
| Asset | Support | Resistance | RSI |
|---|---|---|---|
| BTC | $64,565 (daily low) / $61,511 (weekly low) | $66,200 (daily high) / $67,292 (weekly high) / $69,204 (MA30) | 53.9 — neutral |
| ETH | $1,743 (daily low) / $1,622 (weekly low) | $1,810 (daily high) / $1,850 (weekly high) / $1,875 (MA30) | 45.9 — slightly oversold |
BTC vs ETH Dynamic
The correlation between Bitcoin and Ethereum remains intact, with both assets declining in the past 24 hours, but the magnitude of Ethereum’s drop (1.88%) is more than double that of Bitcoin (0.72%). This divergence is reflected in their respective RSI levels — Bitcoin’s neutral 53.9 versus Ethereum’s bearish-leaning 45.9. Over the past seven days, Ethereum’s 8.49% gain has outperformed Bitcoin’s 6.00% rise, suggesting that during the rally, Ethereum attracted proportionally more buying interest. However, the current session indicates that Ethereum is giving back those gains faster, which is a common pattern in risk-on assets during consolidation. The volume disparity (BTC at 0.61x vs ETH at 0.50x of their 7d averages) also suggests that liquidity is thinner for Ethereum, amplifying its price swings. From a structural perspective, Bitcoin’s price remains closer to its MA7 ($64,945 vs $65,200) than Ethereum is to its MA7 ($1,728 vs $1,759), indicating that Bitcoin’s short-term trend is more firmly established.
Strategy Fit
Given the current market conditions — low volume, neutral-to-slightly-bearish RSI, and prices trading between key support and resistance levels — a range-bound or mean-reversion strategy appears most appropriate. The reduced volatility and lack of directional conviction make trend-following approaches less reliable, as false breakouts are more likely in low-volume environments. A grid trading bot, such as those available on Pionex, can be effective in this scenario by placing buy and sell orders within a defined price range. For Bitcoin, a grid between the daily low of $64,565 and the weekly high of $67,292 could capture profits from oscillations. For Ethereum, a narrower grid between $1,743 and $1,810 aligns with the current daily range.
Alternatively, a DCA (dollar-cost averaging) strategy is suitable for longer-term positions, especially given that both assets are down 15-17% over the past 30 days. DCA reduces the impact of timing the market and benefits from accumulation at lower prices. Pionex’s DCA bot can automate this process. For more aggressive traders, a rebound strategy using limit orders at support levels (BTC at $64,565 or ETH at $1,743) with tight stop-losses below those levels could capture short-term bounces. However, the low volume environment increases the risk of slippage, so position sizing should be conservative. Avoid leveraged strategies until volume picks up and a clearer trend emerges.
Risk Disclaimer
This market recap is provided for informational and educational purposes only. It does not constitute financial advice, investment recommendations, or solicitation to buy or sell any cryptocurrency. All trading involves risk, including the potential loss of principal. Past performance is not indicative of future results. The technical analysis and levels presented are based on historical data and may not predict future price movements. Readers should conduct their own research and consult with a qualified financial advisor before making any trading decisions. The author and platform assume no liability for any losses incurred from the use of this information.
FAQ
Q: Why is Bitcoin’s RSI at 53.9 considered neutral?
A: The Relative Strength Index (RSI) ranges from 0 to 100. Values above 70 are typically considered overbought, and values below 30 are oversold. A reading of 53.9 is near the midpoint, indicating that buying and selling pressure are roughly balanced, with no extreme momentum in either direction.
Q: What does it mean that volume is 0.61x the seven-day average?
A: It means that the current trading volume for Bitcoin is only 61% of the average daily volume over the past seven days. Lower volume often indicates reduced market participation, which can lead to choppy price action and increased susceptibility to sudden moves on news or large orders.
Q: Why is Ethereum’s 30-day decline (-16.70%) worse than Bitcoin’s (-15.14%)?
A: Ethereum has historically exhibited higher volatility than Bitcoin, both to the upside and downside. In the past 30 days, Ethereum’s range (high of $2,158 to low of $1,506) is proportionally wider than Bitcoin’s ($78,200 to $59,131), reflecting its higher beta to market movements.
Q: Can the MA7 and MA30 be used to identify trends?
A: Yes. When the price is above the MA7, it suggests short-term bullish momentum. When the price is below the MA30, it indicates a bearish medium-term trend. The gap between the two moving averages can also signal the strength of the trend — a widening gap suggests stronger momentum, while a narrowing gap may indicate a potential reversal.
Q: What strategies work best in low-volume markets like today?
A: Range-bound strategies such as grid trading or mean reversion are often effective in low-volume markets because prices tend to oscillate between support and resistance without breaking out. DCA is also suitable for accumulation. Trend-following strategies are less reliable due to the higher risk of false breakouts.