BTC ETH Daily Recap — June 22, 2026
BTC ETH Daily Recap — June 22, 2026
Today at a Glance
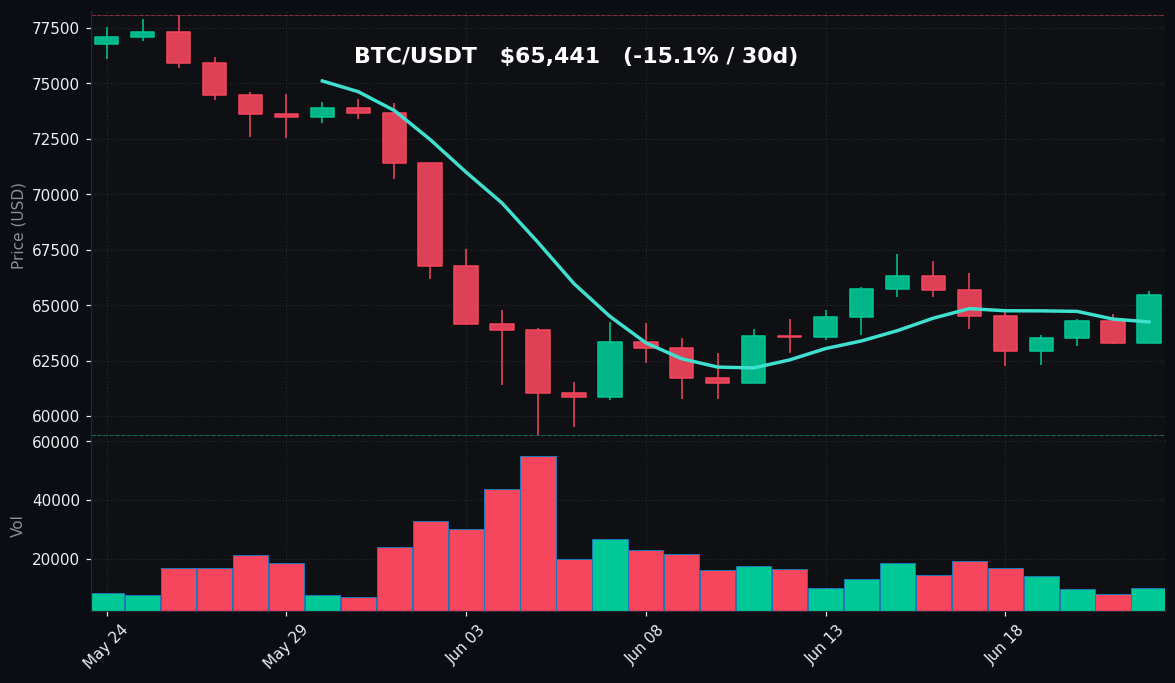
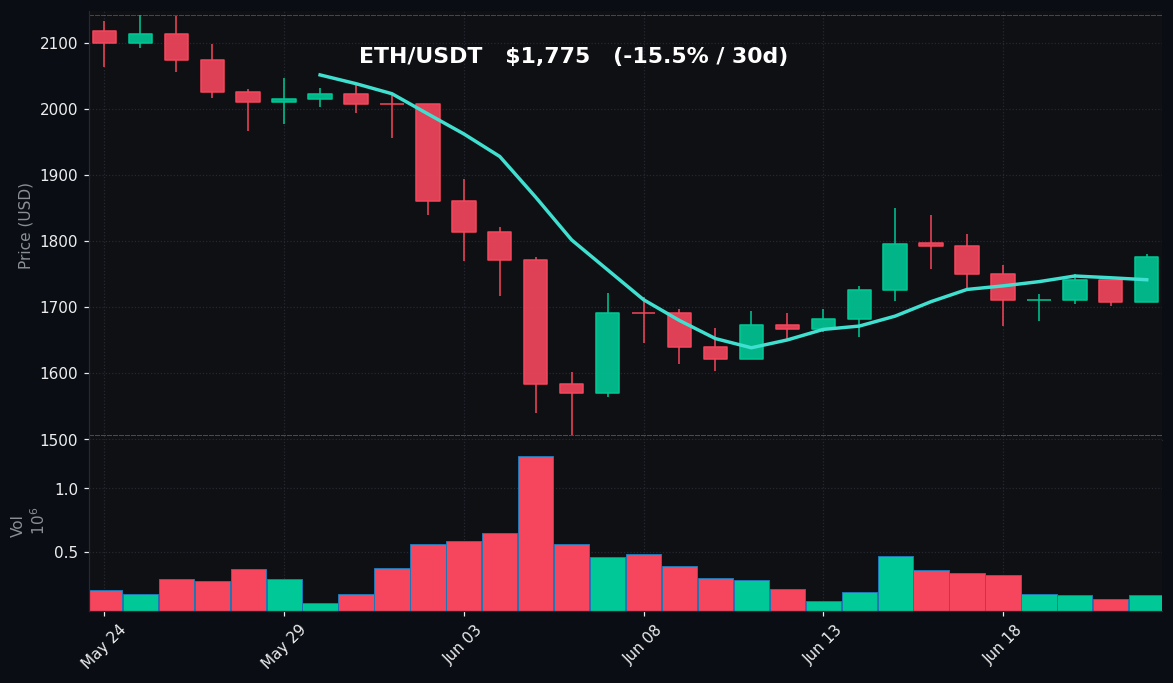
On June 22, 2026, the cryptocurrency market experienced a notable intraday recovery, with both Bitcoin and Ethereum posting solid gains over the past 24 hours. Bitcoin (BTC) traded at $65,441, up 3.36% from the previous day, recovering from a low of $63,312 to hit a daily high of $65,623. Despite this short-term bounce, the weekly trend remains slightly negative at -1.34%, while the 30-day decline of -15.08% underscores a broader bearish pressure. Ethereum (ETH) similarly rallied, gaining 4.00% to $1,775, with a daily range of $1,707 to $1,780. Over the past week, ETH is down 1.17%, and over the past month, it has lost 15.46%. Both assets show RSI(14) readings around 58–59, indicating neutral territory after recent oversold conditions. However, trading volumes for both BTC and ETH are significantly below their 7-day averages (0.69x and 0.57x respectively), suggesting the rally may lack conviction. The market appears to be in a consolidation phase following sharp declines in May and early June, with key support levels holding for now.
Bitcoin Analysis
TradingView Live (4h)
Bitcoin’s price action on June 22 shows a clear intraday recovery from the $63,312 low, closing near the day’s high at $65,441. The 7-day moving average (MA7) at $64,248 has been reclaimed, which is a positive short-term signal. However, the 30-day moving average (MA30) at $67,023 remains above the current price, indicating that the medium-term trend is still bearish. The $65,623 daily high coincides with resistance near the 20-day EMA, which has capped upside moves over the past week. The 7-day high of $66,992 and the 30-day high of $78,080 highlight the significant distance from recent peaks.
Volume analysis reveals a concerning divergence: today’s volume is only 0.69x the 7-day average, meaning the rally is occurring on below-average participation. This suggests that the move may be driven by short covering or limited buying interest rather than strong accumulation. The RSI(14) at 58.2 has moved out of oversold territory (below 30) but remains below 60, indicating neutral momentum without excessive bullish enthusiasm.
Key technical levels to watch: immediate support at $64,248 (MA7) and stronger support at $62,272 (7-day low). On the upside, resistance is clustered around $65,623 (daily high), $66,992 (7-day high), and the MA30 at $67,023. A break above $67,000 would be needed to shift the short-term trend from neutral to bullish. Conversely, a failure to hold $64,000 could lead to a retest of the 30-day low at $59,131. The current structure resembles a range-bound market between $62,000 and $67,000, with no clear directional catalyst.
Ethereum Analysis
TradingView Live (4h)
Ethereum’s performance on June 22 mirrored Bitcoin’s recovery, rising 4.00% to $1,775 from a low of $1,707. The daily high of $1,780 is just below the 7-day moving average at $1,741, which has been reclaimed. However, similar to Bitcoin, the MA30 at $1,811 remains above the current price, confirming a bearish medium-term bias. The 7-day range ($1,672–$1,840) and 30-day range ($1,506–$2,142) illustrate the volatile environment ETH has experienced, with a massive 30-day decline of 15.46%.
Volume for ETH is even weaker than BTC at 0.57x the 7-day average, signaling that the rally lacks strong conviction. The RSI(14) at 58.9 is almost identical to Bitcoin’s, indicating neutral momentum. ETH’s price action has been closely correlated with BTC, but ETH has shown slightly more relative strength in today’s session, gaining a higher percentage.
Key technical levels: immediate support at $1,741 (MA7) and stronger support at $1,672 (7-day low). On the upside, resistance is at $1,780 (daily high), $1,840 (7-day high), and $1,811 (MA30). A sustained move above $1,800 would be a positive sign, potentially targeting the 30-day high of $2,142 in a more bullish scenario. However, the weak volume and overhead moving averages suggest that any upside may be limited in the near term. The $1,500–$1,600 zone remains critical long-term support, representing the 30-day low area.
Key Technical Levels
| Asset | Support | Resistance | RSI |
|---|---|---|---|
| BTC | $64,248 (MA7) / $62,272 (7d low) | $65,623 (daily high) / $67,023 (MA30) | Neutral (58.2) |
| ETH | $1,741 (MA7) / $1,672 (7d low) | $1,780 (daily high) / $1,811 (MA30) | Neutral (58.9) |
BTC vs ETH Dynamic
The correlation between Bitcoin and Ethereum remains strong, as evidenced by their nearly identical price movements over the past 24 hours. Both assets recovered from intraday lows and closed near their daily highs, with ETH slightly outperforming BTC in percentage terms (+4.00% vs +3.36%). The RSI readings are almost identical (58.2 for BTC, 58.9 for ETH), indicating synchronized momentum. This high correlation suggests that market participants are treating both assets similarly, with no significant divergence in sentiment. The ETH/BTC ratio remains relatively stable, with ETH trading at approximately 0.0271 BTC, which is within the recent range. In a low-volume environment, directional moves tend to be correlated, and today’s session is no exception. The lack of a clear catalyst for either asset means that BTC continues to lead, and ETH follows.
Strategy Fit
Given the current market conditions—low volume, neutral RSI, and a range-bound structure—a grid trading strategy is well-suited for both BTC and ETH. The price is oscillating between well-defined support and resistance levels, providing opportunities to profit from mean reversion. For BTC, a grid between $62,000 and $67,000 would capture the current range; for ETH, a grid between $1,670 and $1,820 aligns with the 7-day range. Pionex’s built-in grid trading bots can automate this strategy, allowing traders to profit from volatility without needing to time entries and exits. Alternatively, a DCA (dollar-cost averaging) approach is also appropriate for long-term holders, as the 30-day decline has brought prices to relatively attractive levels compared to the monthly highs. Trend-following strategies are less suitable at this time due to the lack of a clear directional trend. Traders should monitor volume closely: a volume spike above the 7-day average could signal a breakout, at which point a trend-following bot may become more effective. For now, patience and range-bound strategies are recommended.
Risk Disclaimer
This market recap is for informational and educational purposes only and does not constitute financial advice, investment recommendations, or trading signals. Cryptocurrency markets are highly volatile and involve substantial risk of loss. Past performance is not indicative of future results. You should conduct your own research and consult with a qualified financial advisor before making any investment decisions. The data presented is based on publicly available information and may contain errors or omissions. The author and Pionex shall not be held liable for any losses or damages arising from the use of this content.
FAQ
Q: Why did BTC and ETH rally today despite low volume?
A: The rally on June 22 occurred on below-average volume (0.69x for BTC, 0.57x for ETH), which often indicates that the move is driven by short covering or limited buying interest rather than strong accumulation. Low-volume rallies can be fragile and may not sustain without a catalyst or increased participation.
Q: What are the key support levels to watch for BTC and ETH?
A: For Bitcoin, immediate support is at $64,248 (MA7) and stronger support at $62,272 (7-day low). For Ethereum, support is at $1,741 (MA7) and $1,672 (7-day low). A break below these levels could lead to a retest of the 30-day lows ($59,131 for BTC, $1,506 for ETH).
Q: Is the RSI indicating that BTC and ETH are oversold or overbought?
A: The RSI(14) for both BTC (58.2) and ETH (58.9) is in neutral territory, between 30 and 70. This means neither asset is oversold nor overbought. The recent recovery from lower levels has moved them out of oversold territory, but they have not yet reached overbought conditions.
Q: How does the 30-day decline affect the market outlook?
A: The 30-day declines of -15.08% for BTC and -15.46% for ETH indicate a bearish medium-term trend. However, the fact that both assets are holding above their 30-day lows ($59,131 for BTC, $1,506 for ETH) suggests that selling pressure may be exhausting. A sustained move above the MA30 would be needed to confirm a trend reversal.
Q: What trading strategy is most appropriate in this low-volume environment?
A: In a low-volume, range-bound market, grid trading is often the most effective strategy. It allows traders to profit from price oscillations between support and resistance levels. Pionex’s grid trading bots can automate this process. DCA is also suitable for long-term accumulation, while trend-following strategies should be avoided until a clear breakout occurs.