BTC ETH Daily Recap – June 12, 2026
BTC ETH Daily Recap – June 12, 2026
Today at a Glance
The cryptocurrency market continues to exhibit a cautious tone on June 12, 2026, with both Bitcoin and Ethereum experiencing slight declines over the past 24 hours. Bitcoin (BTC) is currently trading at $63,376, down 0.39% in the day, though it remains up 3.80% over the past week. Ethereum (ETH) is at $1,664, a 0.57% daily decrease, with a weekly gain of 5.09%. Despite the short-term stabilization, both assets remain deep in bearish territory over the 30-day timeframe, with BTC down 21.85% and ETH down 27.12% from their respective highs. The Relative Strength Index (RSI) for both assets is deeply oversold—BTC at 24.9 and ETH at 25.4—indicating persistent selling pressure. Trading volumes have dropped significantly, with BTC volume at 0.38x the 7-day average and ETH at just 0.20x, suggesting reduced market participation. Key support levels are being tested, while the 30-day moving averages ($71,377 for BTC, $1,949 for ETH) remain well above current prices, reinforcing the medium-term downtrend.
Bitcoin Analysis
TradingView Live (4h)
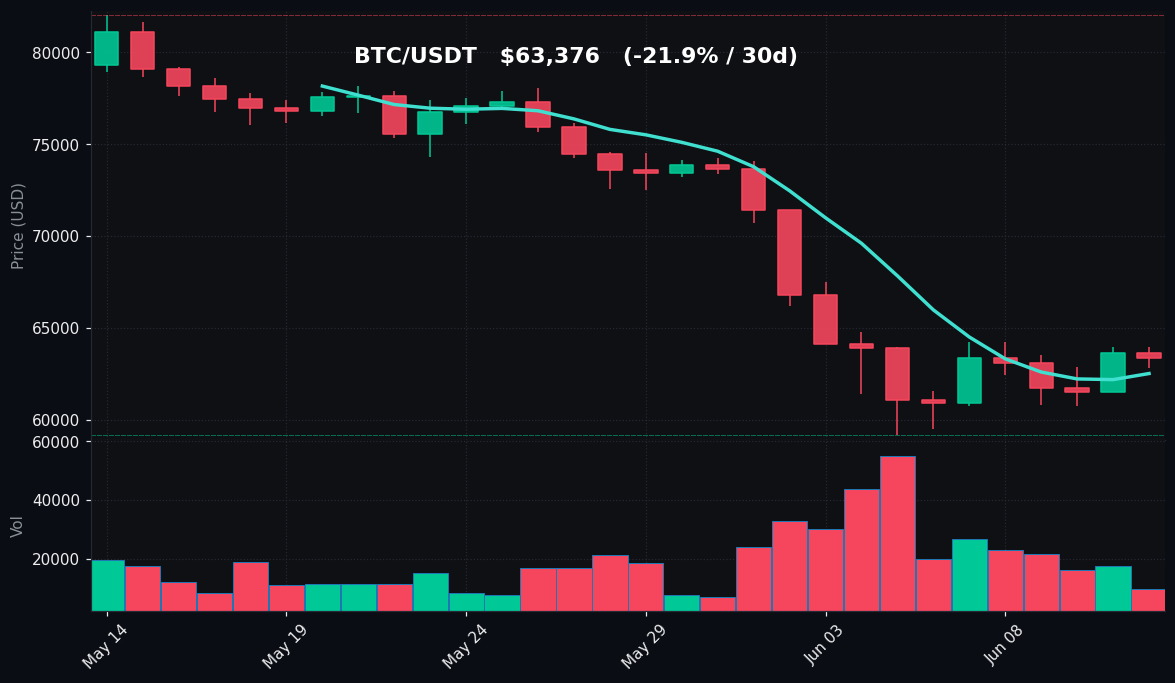
Bitcoin’s price action on June 12 reflects a market in consolidation within a broader downtrend. The current price of $63,376 sits just above the 7-day moving average of $62,506, indicating short-term support has formed near the $62,800-$63,000 zone, as evidenced by today’s low of $62,830. However, the asset remains significantly below its 30-day moving average of $71,377, a gap of approximately 12.5%, which underscores the severity of the recent sell-off. The 7-day high of $64,235 was set earlier this week, and BTC has been unable to reclaim that level, suggesting resistance is firming around $64,000-$64,200.
The RSI(14) reading of 24.9 is deeply oversold, a condition that has historically preceded short-term bounces, but the lack of volume confirmation (0.38x the 7-day average) weakens the case for an immediate reversal. The 30-day high of $82,048, recorded just one month ago, now seems distant, and the 30-day low of $59,131 represents a critical support level that was tested on June 8. The volume contraction is particularly notable—traders are stepping aside, which can lead to either a sharp move if liquidity returns or continued drift lower.
From a technical structure perspective, BTC has formed a lower high at $64,235 compared to the previous week’s peak, and the 7-day MA is sloping upward slightly, but the 30-day MA remains in a steep decline. The Bollinger Bands (not explicitly provided but inferred from volatility) are likely wide, reflecting the recent 30-day range of nearly $23,000. The key question for traders is whether the $62,800 support holds or gives way to a retest of the $59,131 low. The oversold RSI suggests exhaustion among sellers, but without volume, a sustainable recovery is difficult to confirm.
Ethereum Analysis
TradingView Live (4h)
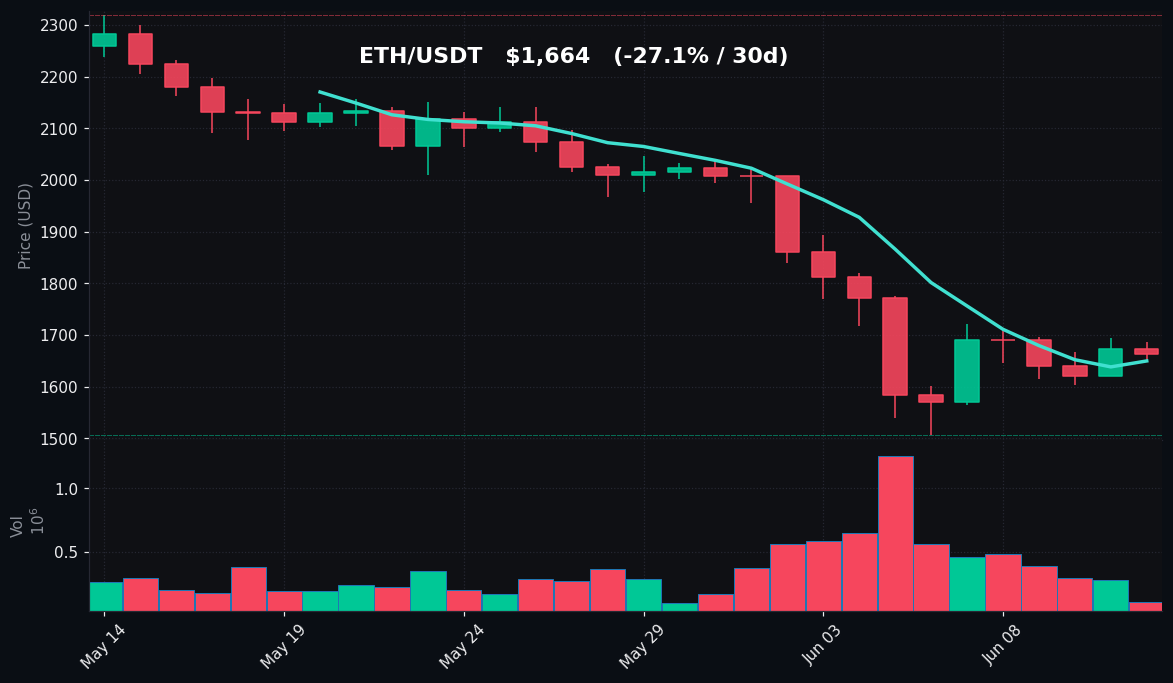
Ethereum is mirroring Bitcoin’s pattern but with even greater relative weakness over the 30-day period. At $1,664, ETH is trading just above its 7-day moving average of $1,650, which has acted as dynamic support during the past week. The daily range of $1,652 to $1,686 is narrow, indicating low volatility and indecision. The 30-day moving average of $1,949 is a full 17% above the current price, highlighting the bearish medium-term trend. The 7-day high of $1,722 was set on June 10, and ETH has since pulled back, failing to sustain momentum above $1,700.
The RSI(14) of 25.4 is similarly oversold, slightly higher than BTC’s but still in deeply bearish territory. Volume is extremely low at 0.20x the 7-day average, suggesting that the current price discovery is happening with minimal participation. The 30-day low of $1,506, touched on June 8, represents a critical floor—if broken, the next major support would likely be around $1,400. The 30-day high of $2,319 seems like a distant memory, and the 27.12% monthly decline is the largest among major cryptocurrencies.
Ethereum’s technical setup shows a potential double-bottom formation around the $1,506 low if the price holds above that level, but confirmation would require a break above $1,722 (the 7-day high) and then $1,800. The current consolidation between $1,650 and $1,686 is tight, and a breakout in either direction could be significant given the low volume environment. The 7-day MA is flatlining, suggesting that the short-term trend has lost direction. For now, ETH remains in a bear flag pattern, and the oversold RSI may attract dip buyers, but the lack of volume is a major red flag for any immediate reversal.
Key Technical Levels
| Asset | Support | Resistance | RSI |
|---|---|---|---|
| BTC | $62,830 (daily low) / $59,131 (30d low) | $64,235 (7d high) / $71,377 (MA30) | 24.9 – Oversold |
| ETH | $1,652 (daily low) / $1,506 (30d low) | $1,722 (7d high) / $1,949 (MA30) | 25.4 – Oversold |
BTC vs ETH Dynamic
The correlation between Bitcoin and Ethereum remains high, as both assets exhibit nearly identical technical patterns: oversold RSI readings, low volume, and consolidation near short-term moving averages. However, Ethereum’s 30-day decline of 27.12% is more severe than Bitcoin’s 21.85%, indicating that ETH has been the weaker performer during this sell-off. The BTC/ETH ratio has consequently risen, favoring Bitcoin as the relative store of value within the crypto space. Both assets are trading below their 30-day MAs, confirming a synchronized bearish medium-term trend. The divergence in 7-day performance (BTC +3.80%, ETH +5.09%) shows a slight edge for ETH in the short-term recovery, but this is likely a catch-up move rather than a sign of relative strength. The volume disparity is also notable—BTC’s volume is nearly double ETH’s relative to their respective averages, suggesting that Bitcoin is still the primary focus for traders.
Strategy Fit
Given the current market conditions—deeply oversold RSI, low volume, and consolidation near support—a neutral to cautiously defensive strategy is appropriate. Grid trading on Pionex is well-suited for this environment, as it allows traders to profit from range-bound price movements without predicting direction. With BTC oscillating between $62,800 and $64,200, a narrow grid with 0.3% to 0.5% spacing can capture small intraday moves. For ETH, a grid between $1,650 and $1,720 would cover the recent range.
Dollar-cost averaging (DCA) is also a viable strategy for long-term accumulators, given the oversold conditions. Pionex’s DCA bot can be set to buy small amounts daily or weekly, averaging into the position over time. However, given the absence of a clear bottom signal, DCA should be paired with a stop-loss or a defined budget.
Trend-following strategies are not recommended at this time, as both assets lack a clear directional trend—the 7-day MA is flat, and the 30-day MA is falling. A trend strategy would likely generate false signals in this low-volume consolidation. Pionex’s Reversal AI bot could be considered if a clear bounce from support occurs, but only with tight risk management.
Given the low volatility (narrow daily ranges), high-frequency strategies may underperform due to spreads. The best fit is a low-frequency grid or DCA with a medium-term horizon, acknowledging that the oversold RSI may lead to a snap rally but the fundamental lack of volume argues against aggressive positioning.
Risk Disclaimer
This market recap is for informational and educational purposes only and does not constitute financial advice, investment recommendation, or solicitation to buy or sell any asset. Cryptocurrency trading involves substantial risk, including the potential loss of principal. Past performance is not indicative of future results. Technical indicators and levels are based on historical data and may not predict future price movements. Always conduct your own research, consult a qualified financial advisor, and never invest more than you can afford to lose. The author and Pionex are not responsible for any trading losses incurred.
FAQ
Q: Why is the RSI so low for both BTC and ETH?
A: The RSI (Relative Strength Index) measures the magnitude of recent price changes. Readings below 30 indicate oversold conditions, meaning prices have declined sharply over the past 14 days. For BTC at 24.9 and ETH at 25.4, this reflects persistent selling pressure and weak buying interest, often seen during bearish phases.
Q: What does low volume (0.38x and 0.20x) mean for the market?
A: Low volume relative to the 7-day average indicates reduced trader participation. This can lead to increased volatility on low liquidity, meaning price moves may be exaggerated. It also suggests that the current price levels are not being heavily contested, which can precede either a breakout or a breakdown.
Q: Are these support levels strong enough to hold?
A: The $62,830 support for BTC and $1,652 for ETH are short-term levels based on today’s lows. The more significant supports are the 30-day lows at $59,131 (BTC) and $1,506 (ETH). A break below today’s lows could accelerate selling toward those levels. The oversold RSI does not guarantee support will hold.
Q: How does the 30-day moving average affect price?
A: The 30-day MA is a medium-term trend indicator. Both BTC ($71,377) and ETH ($1,949) are well below their 30-day MAs, confirming a bearish trend. Until prices can reclaim these levels, the bias remains negative. The 30-day MA often acts as resistance during downtrends.
Q: What should traders watch for next?
A: Key events include a close above the 7-day highs ($64,235 for BTC, $1,722 for ETH) for a short-term bullish signal, or a break below today’s lows for further downside. Volume is critical—any move with above-average volume would carry more conviction. Additionally, watching for a potential RSI divergence (price making lower lows while RSI makes higher lows) could signal a reversal.