BTC ETH Daily Recap | July 2, 2026

BTC ETH Daily Recap | July 2, 2026
Today at a Glance
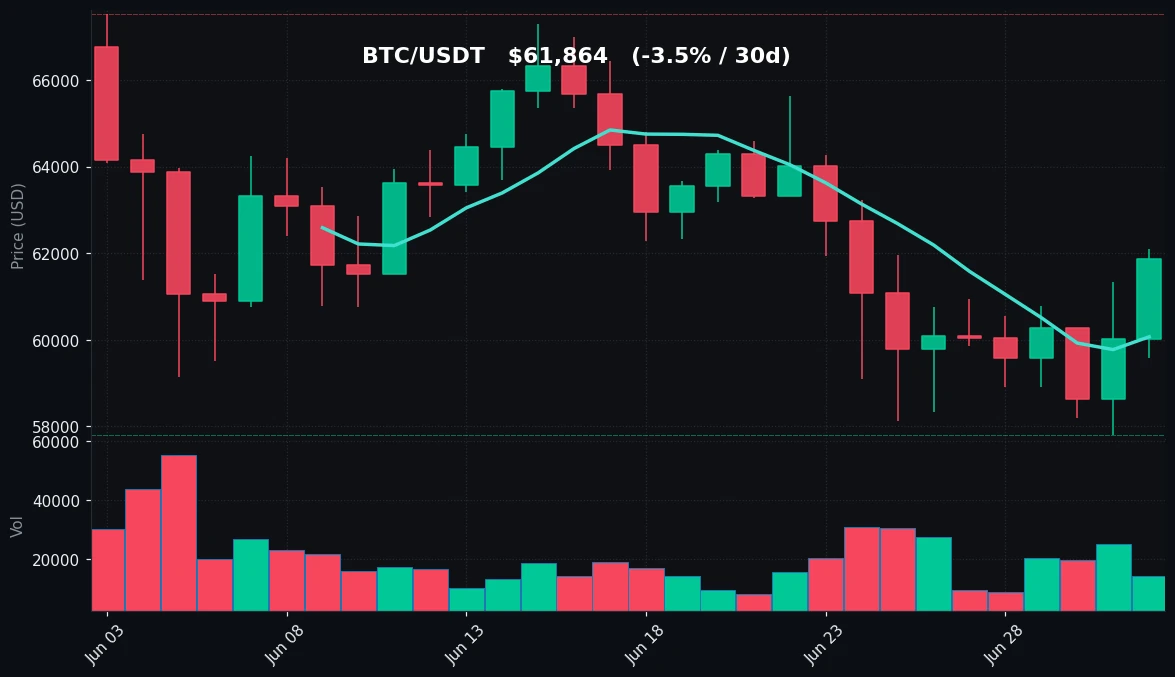
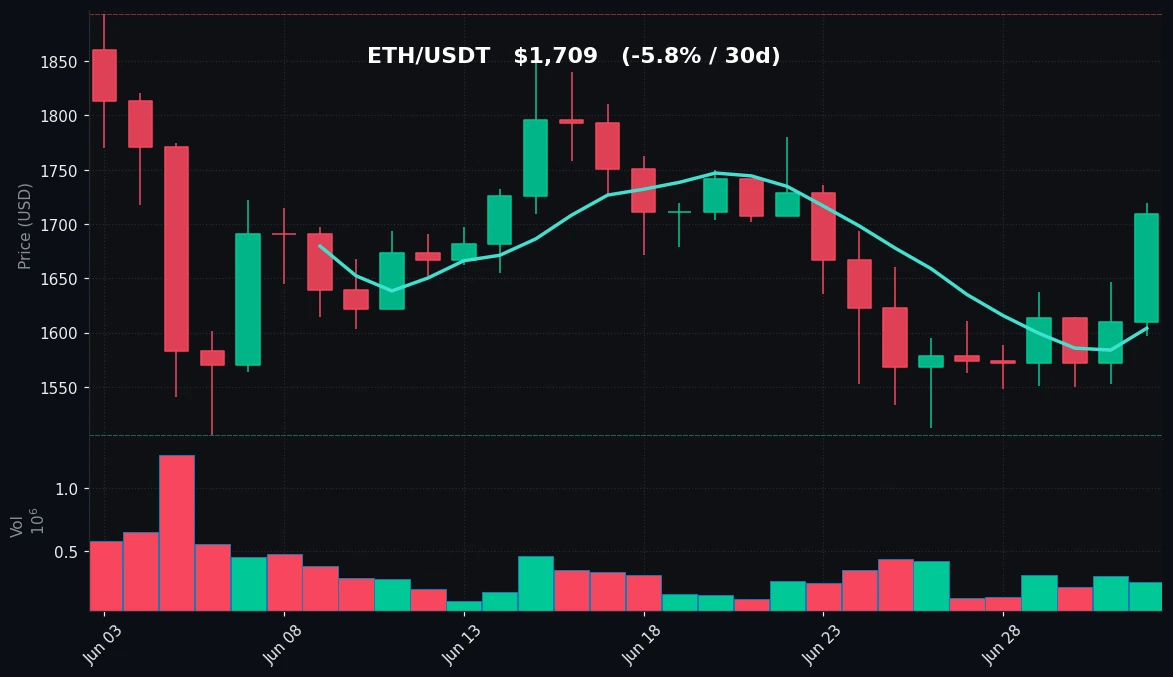
The crypto market showed moderate recovery on July 2, 2026, with Bitcoin gaining 3.07% in the past 24 hours to trade at $61,864, while Ethereum posted a stronger 6.16% increase to $1,709. BTC's intraday high reached $62,100, just above its 7-day high, while ETH hit $1,720 — its highest level in the past week. Both assets remain in a corrective phase over the 30-day window, with BTC down 3.55% and ETH down 5.75% from their monthly highs. Volume remains below average for BTC (0.7x of 7-day average) but closer to normal for ETH (0.91x). RSI readings for both assets are in neutral territory — BTC at 46.0 and ETH at 49.8 — suggesting no immediate overbought or oversold conditions. The 7-day moving average for BTC sits at $60,068 and for ETH at $1,604, indicating both assets are trading above their short-term trend lines. The 30-day moving averages, however, remain overhead at $62,526 for BTC and $1,672 for ETH, acting as key resistance levels.
Bitcoin Analysis
TradingView Live (4h)
Bitcoin's price action on July 2 reflects a cautious upward move from the $59,588 intraday low, recovering toward the $62,000 region. The asset is currently trading at $61,864, which places it above the 7-day moving average of $60,068 but below the 30-day moving average of $62,526. This positioning indicates that while short-term momentum is improving, the broader monthly trend remains bearish. The 7-day high of $62,100 was tested today, and the inability to close decisively above this level suggests sellers remain active near the $62,000-$62,500 zone.
Volume analysis reveals a notable divergence: the current 24-hour volume is only 0.7 times the 7-day average, meaning today's rally is occurring on lower-than-average participation. This often signals a lack of conviction behind the move, making the advance susceptible to reversal if buying pressure does not increase. The RSI at 46.0 is in the lower half of neutral territory, indicating that selling pressure has eased but buying momentum has not yet gained dominance. The 30-day low of $57,800, established earlier in the week, remains a critical support level, while the 30-day high of $67,516 is a distant resistance.
From a technical structure perspective, BTC is attempting to form a higher low after the $57,800 trough. The recent bounce from $59,588 today aligns with this pattern. However, the declining 30-day MA ($62,526) is acting as a dynamic resistance. A sustained move above $62,100-$62,500 with increasing volume would be needed to shift the short-term bias from neutral to bullish. Conversely, failure to hold above $60,000 could re-expose the $57,800 support. The volume deficit remains the primary concern for bulls.
Ethereum Analysis
TradingView Live (4h)
Ethereum outperformed Bitcoin today with a 6.16% gain, reaching an intraday high of $1,720 — its 7-day high — from a low of $1,597. This represents a 7.7% intraday range, reflecting higher volatility compared to BTC. ETH is currently trading at $1,709, well above its 7-day moving average of $1,604 but still below the 30-day moving average of $1,672. The fact that ETH is now trading above its 30-day MA is a positive divergence from BTC, suggesting relative strength.
The 7-day performance of +8.99% for ETH significantly outpaces BTC's +3.46%, indicating capital rotation into the second-largest cryptocurrency. However, the 30-day performance remains negative at -5.75%, with the monthly high of $1,893 still 10.7% above current prices. The 30-day low of $1,506, established on June 26, now serves as a strong support level, while the $1,720 resistance (today's high) is the immediate barrier.
Volume for ETH is at 0.91x the 7-day average, much closer to normal levels than BTC. This suggests the rally has more participation, lending credibility to the move. The RSI at 49.8 is almost exactly at the 50 midpoint, indicating neutral momentum. The move above the 30-day MA ($1,672) is technically significant, as it was the first time since mid-June that ETH closed above this level. If ETH can hold above $1,672, it could target the next resistance at $1,750-$1,800, where the 50-day MA likely resides. The $1,597 intraday low from today provides immediate support.
Key Technical Levels
| Asset | Support | Resistance | RSI |
|---|---|---|---|
| BTC | $60,068 (MA7), $57,800 (30d low) | $62,100 (7d high), $62,526 (MA30) | Neutral (46.0) |
| ETH | $1,604 (MA7), $1,506 (30d low) | $1,720 (7d high), $1,893 (30d high) | Neutral (49.8) |
BTC vs ETH Dynamic
The correlation between Bitcoin and Ethereum remains positive, but today's action shows a clear divergence in relative strength. ETH's 24-hour gain of 6.16% versus BTC's 3.07% represents a 2:1 outperformance ratio. This is reflected in the ETH/BTC ratio, which likely moved higher. ETH's ability to reclaim its 30-day moving average while BTC remains below its own MA30 suggests that capital is flowing from BTC to ETH, a pattern often seen during risk-on rotations within the crypto market. Historically, when ETH leads BTC higher, it signals increased speculative appetite. However, the overall volume deficit across both assets limits the conviction of a sustained trend shift. The 7-day performance spread of 8.99% (ETH) vs 3.46% (BTC) reinforces the idea that ETH is currently the preferred vehicle for upside exposure.
Strategy Fit
Given the current market conditions — moderate recovery with below-average volume and neutral RSI readings — a grid trading strategy is the most appropriate fit for both BTC and ETH. The price action is oscillating within defined ranges (BTC: $57,800-$62,100; ETH: $1,506-$1,720) without clear directional conviction. Grid bots on Pionex can capitalize on these range-bound movements by placing buy orders near support and sell orders near resistance, profiting from the volatility within the range. For BTC, a neutral grid with a range of $58,000 to $62,500 would capture the current price band. For ETH, a range of $1,550 to $1,750 aligns with the recent price action.
Alternatively, a DCA (Dollar-Cost Averaging) strategy is suitable for investors with a longer-term horizon, given that both assets are trading below their 30-day moving averages and are in a corrective phase. Pionex's DCA bot can systematically accumulate positions at lower prices, reducing the impact of short-term volatility. The current volume deficit suggests that impulsive trend-following strategies carry higher risk of false breakouts. Trend trading is not recommended until volume confirms the direction — either a breakout above $62,500 for BTC or $1,750 for ETH on above-average volume.
Risk Disclaimer
This market recap is for informational and educational purposes only and does not constitute financial advice, investment recommendation, or solicitation to buy or sell any digital assets. Cryptocurrency markets are highly volatile and involve substantial risk of loss. Past performance is not indicative of future results. All trading decisions should be made based on your own research, risk tolerance, and financial situation. You should consult with a qualified financial advisor before engaging in any trading activity. The technical analysis presented is based on historical price data and does not guarantee future outcomes.
FAQ
Q: Why is Bitcoin's volume lower than average despite the price increase?
A: Volume at 0.7x the 7-day average indicates that fewer traders are participating in today's rally. Low-volume moves are often less reliable and can be more susceptible to sudden reversals. This suggests the current upward momentum lacks broad market conviction.
Q: What does RSI of 46.0 for Bitcoin mean?
A: An RSI of 46.0 is in neutral territory, slightly below the 50 midpoint. It indicates that selling pressure has eased but buying momentum has not yet taken control. It is neither oversold (below 30) nor overbought (above 70), meaning there is room for movement in either direction.
Q: Why is Ethereum outperforming Bitcoin today?
A: ETH's 6.16% gain versus BTC's 3.07% suggests capital rotation from Bitcoin to Ethereum. This is often seen when traders seek higher beta exposure during recovery phases. ETH also reclaimed its 30-day moving average, a technical milestone that BTC has not yet achieved.
Q: What are the key levels to watch for Bitcoin and Ethereum?
A: For BTC, immediate resistance is at $62,100 (7-day high) and $62,526 (30-day MA), with support at $60,068 (7-day MA) and $57,800 (30-day low). For ETH, resistance is at $1,720 (7-day high) and $1,893 (30-day high), with support at $1,604 (7-day MA) and $1,506 (30-day low).
Q: Which trading strategy is best for current market conditions?
A: Grid trading is recommended for range-bound conditions, as prices oscillate within established support and resistance zones. DCA (Dollar-Cost Averaging) is suitable for longer-term accumulation. Trend-following strategies are not advised until volume confirms a clear directional breakout.


