BTC ETH Daily Recap | June 1, 2026
BTC ETH Daily Recap | June 1, 2026
Today at a Glance
The cryptocurrency market opened the first day of June under sustained selling pressure, with both Bitcoin and Ethereum extending their weekly losses. Bitcoin (BTC) is trading at $71,849, down 2.48% in the last 24 hours, after touching a daily low of $71,390 and a high of $74,092. The leading cryptocurrency has now declined 7.08% over the past seven days and 8.55% over the past 30 days, reflecting a broad correction from its 30-day high of $82,850. Ethereum (ETH) is priced at $1,976, a 1.54% drop in the past 24 hours, with a daily range between $1,956 and $2,022. ETH has underperformed BTC on a monthly basis, losing 14.92% over the last 30 days compared to BTC’s 8.55% decline. Both assets are trading below their 7-day and 30-day moving averages, with RSI readings in oversold territory—BTC at 26.8 and ETH at 28.2. Trading volumes remain near the 7-day average, indicating no panic selling or accumulation surge. The market is in a clear downtrend, with key support levels being tested.
Bitcoin Analysis
TradingView Live (4h)
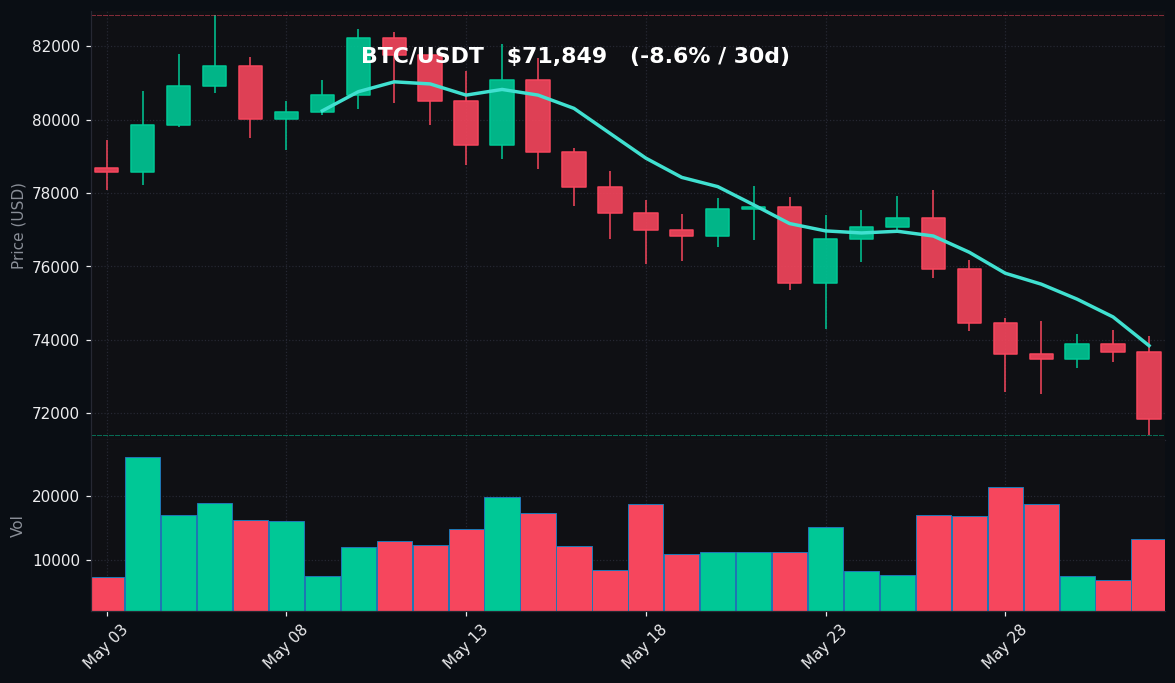
Bitcoin’s price action on June 1 confirms a continuation of the bearish trend that began after the asset failed to hold above the $78,000 level earlier in the week. The daily high of $74,092 was met with immediate selling pressure, pushing BTC to a low of $71,390 before stabilizing near $71,849. This marks the lowest price point in the last 30 days, breaking below the previous 30-day low of $71,390 (which was matched today). The 7-day moving average (MA7) now sits at $73,838, while the 30-day moving average (MA30) is at $77,793. BTC is trading well below both averages, a classic sign of bearish momentum. The gap between the MA7 and MA30 is widening, suggesting that short-term selling pressure is outpacing the medium-term trend.
The Relative Strength Index (RSI) on the 14-day timeframe has dropped to 26.8, firmly in oversold territory (below 30). This is the lowest RSI reading for BTC in the past 30 days, indicating that selling has been aggressive and sustained. Historically, such oversold conditions can precede a technical bounce, but they do not guarantee one—especially if macro sentiment remains negative. Volume is at 0.97x the 7-day average, meaning there is no unusual spike in trading activity. This suggests that the decline is not driven by a single catalyst but rather by persistent distribution.
Key support to watch is the $71,390 level, which acted as today’s low and has been tested multiple times over the past 30 days. A break below this level could open the door to the $70,000 psychological zone. On the upside, resistance is found at $73,838 (MA7) and then $77,793 (MA30). A reclaim of the MA7 would be the first sign of stabilization, but a move above $78,000 is needed to shift the short-term trend. The overall structure remains bearish, with lower highs and lower lows established over the past two weeks.
Ethereum Analysis
TradingView Live (4h)
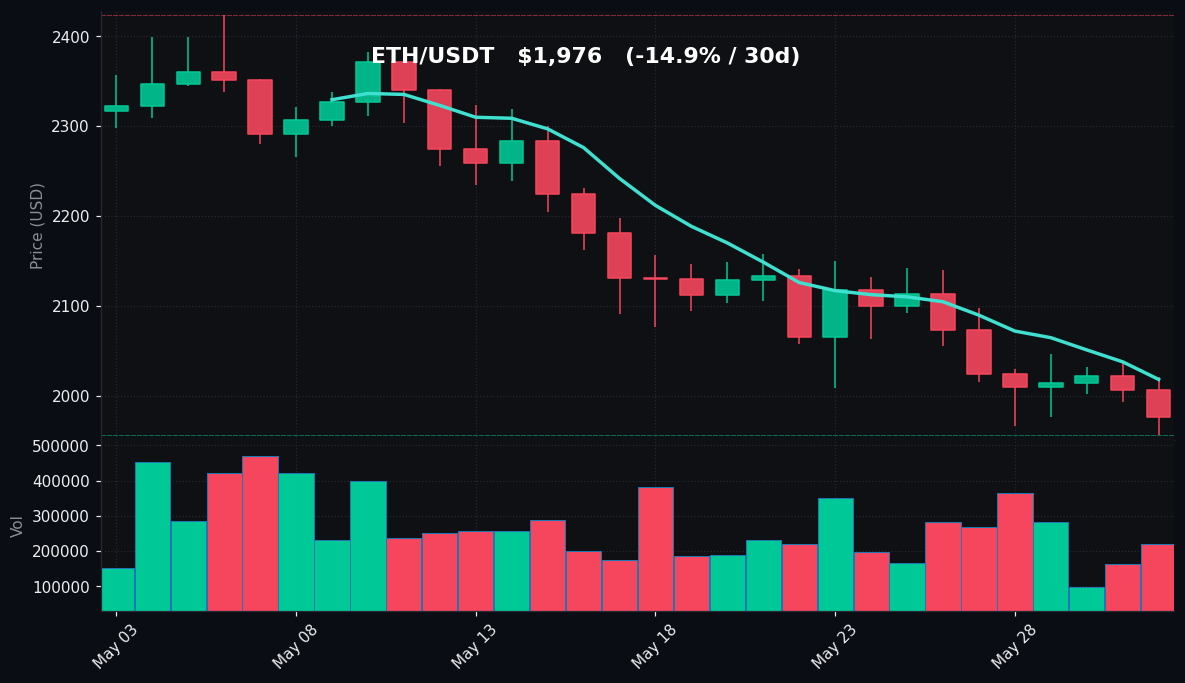
Ethereum is trading at $1,976, down 1.54% in the past 24 hours, with a daily range of $1,956 to $2,022. The asset has been under heavier selling pressure than Bitcoin over the past 30 days, losing 14.92% compared to BTC’s 8.55% decline. Today’s low of $1,956 marks a new 30-day low, breaking below the previous floor of $1,960. The 7-day moving average (MA7) is at $2,018, and the 30-day moving average (MA30) is at $2,180. ETH is trading below both averages, and the MA7 is now below the MA30, confirming a bearish crossover. This is a bearish signal that often precedes further downside if volume picks up.
The RSI(14) for ETH stands at 28.2, also in oversold territory. This is the lowest RSI reading for ETH in the past 30 days, and it aligns with the oversold condition seen in BTC. Volume is at 0.95x the 7-day average, indicating that the selling is steady but not panicked. The lack of volume amplification suggests that institutional or large-scale selling is not accelerating; rather, it is a continuation of the distribution pattern seen over the past week.
Key support for ETH is at $1,956 (today’s low) and then $1,900, a psychological level that has not been tested since early May. Resistance is at $2,018 (MA7) and $2,140 (the 7-day high). A move above $2,022 (today’s high) would be the first bullish sign, but a reclaim of the MA7 at $2,018 is necessary for any short-term recovery. The RSI oversold reading suggests that a bounce could occur, but the trend remains firmly bearish until ETH can close above $2,140. The divergence between ETH and BTC—with ETH underperforming—is a concern for altcoin sentiment.
Key Technical Levels
| Asset | Support | Resistance | RSI |
|---|---|---|---|
| BTC | $71,390 / $70,000 | $73,838 (MA7) / $77,793 (MA30) | Oversold (26.8) |
| ETH | $1,956 / $1,900 | $2,018 (MA7) / $2,140 (7d high) | Oversold (28.2) |
BTC vs ETH Dynamic
The correlation between Bitcoin and Ethereum remains high, but Ethereum is underperforming significantly on a relative basis. Over the past 30 days, BTC has declined 8.55% while ETH has dropped 14.92%, meaning ETH has lost roughly 1.75x more value than BTC. This divergence is typical in bearish phases where investors rotate from altcoins into Bitcoin as a relative safe haven. The BTC/ETH ratio has risen from approximately 34.5 at the start of the month to 36.4 today, indicating that Bitcoin is capturing a larger share of market value. For a bullish reversal in the broader market, ETH needs to stabilize and show relative strength against BTC. Until then, the risk remains skewed to the downside for altcoins.
Strategy Fit
Given the current market conditions—both BTC and ETH are in oversold territory with sustained bearish momentum and no volume surge—a grid trading strategy is the most appropriate fit. The market is range-bound within the day’s low and high, and oversold conditions often lead to choppy, sideways price action before a decisive move. A neutral grid bot, such as Pionex’s Infinity Grid, can capture profits from small intraday fluctuations while avoiding directional bets. For traders with a bearish bias, a short grid or a reverse grid could be considered, but the oversold RSI suggests caution against aggressive short positions. Dollar-cost averaging (DCA) is also viable for long-term holders, but the trend is downward, so DCA should be executed with smaller increments to avoid buying into a falling knife. Trend-following strategies are not recommended because the trend is clearly bearish, and entering late could result in catching the bottom of a move. Pionex’s built-in trading bots, such as the Spot Grid and DCA bot, are well-suited for these conditions as they automate the process of buying low and selling high within a defined range, or averaging into a position over time.
Risk Disclaimer
This market recap is for informational and educational purposes only. It does not constitute financial advice, investment recommendation, or solicitation to buy or sell any digital assets. Cryptocurrency markets are highly volatile and involve substantial risk. Past performance is not indicative of future results. Always conduct your own research and consult with a qualified financial advisor before making any investment decisions. The author and platform may hold positions in the assets discussed.
FAQ
Q: Why are BTC and ETH both in oversold territory?
A: Both assets have experienced sustained selling pressure over the past 7 to 30 days, with prices falling below key moving averages. The RSI(14) for BTC is 26.8 and for ETH is 28.2, both below the oversold threshold of 30. This indicates that the selling has been aggressive and that the market may be due for a technical bounce, though no reversal is guaranteed.
Q: What does it mean when BTC is trading below both MA7 and MA30?
A: Trading below the 7-day moving average (MA7) and the 30-day moving average (MA30) is a bearish signal. It indicates that short-term and medium-term momentum are both negative. The widening gap between the MA7 and MA30 suggests that selling pressure is accelerating relative to the longer-term trend.
Q: Is today’s low of $71,390 a strong support for Bitcoin?
A: The $71,390 level is significant because it matched the 30-day low. However, it has been tested multiple times recently, and each test weakens the support. If BTC closes below $71,390, the next major support is around $70,000, a psychological level. Traders should watch for a bounce or breakdown at this level.
Q: Why is Ethereum underperforming Bitcoin so much?
A: Ethereum’s underperformance is typical in bearish phases where investors rotate from altcoins into Bitcoin as a relative safe haven. The 30-day decline of 14.92% for ETH versus 8.55% for BTC reflects this rotation. Additionally, ETH has lower liquidity and higher volatility, making it more sensitive to selling pressure.
Q: What trading strategy works best in this market?
A: Given the oversold conditions and lack of volume surge, a neutral grid trading strategy is recommended. It allows traders to profit from small price fluctuations within the day’s range without taking a directional bet. Pionex’s Infinity Grid bot is a good tool for this environment. Dollar-cost averaging (DCA) is also viable for long-term holders, but with smaller increments to manage risk.