BTC ETH Daily Recap | June 8, 2026
BTC ETH Daily Recap | June 8, 2026
Today at a Glance
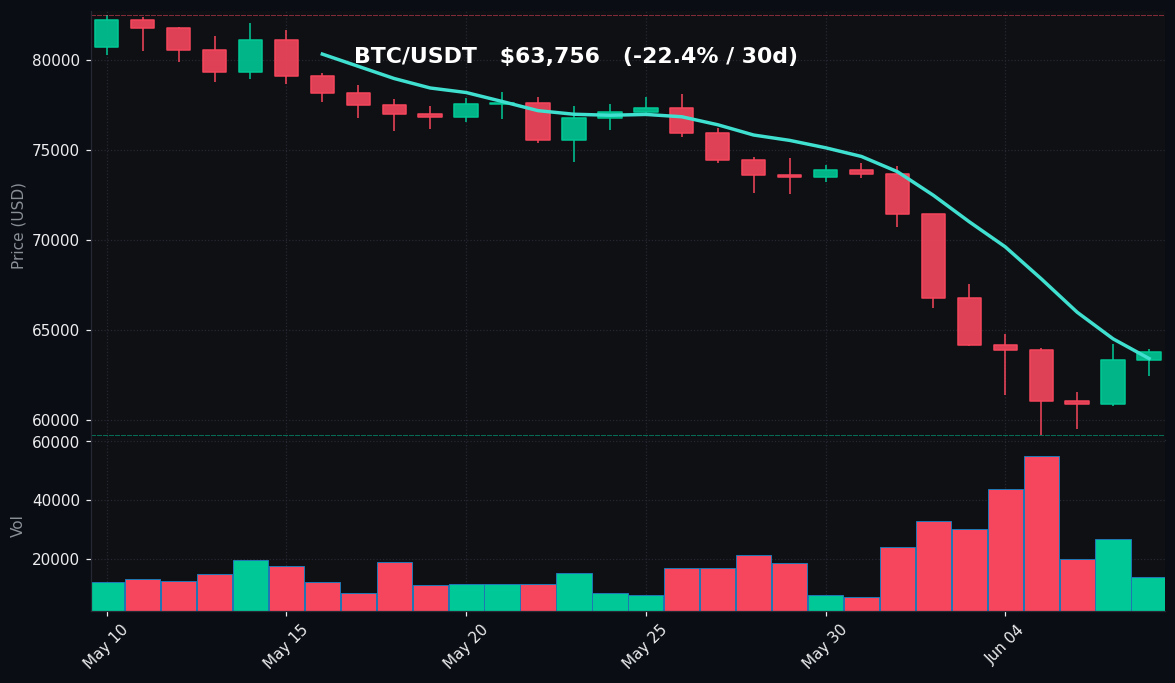
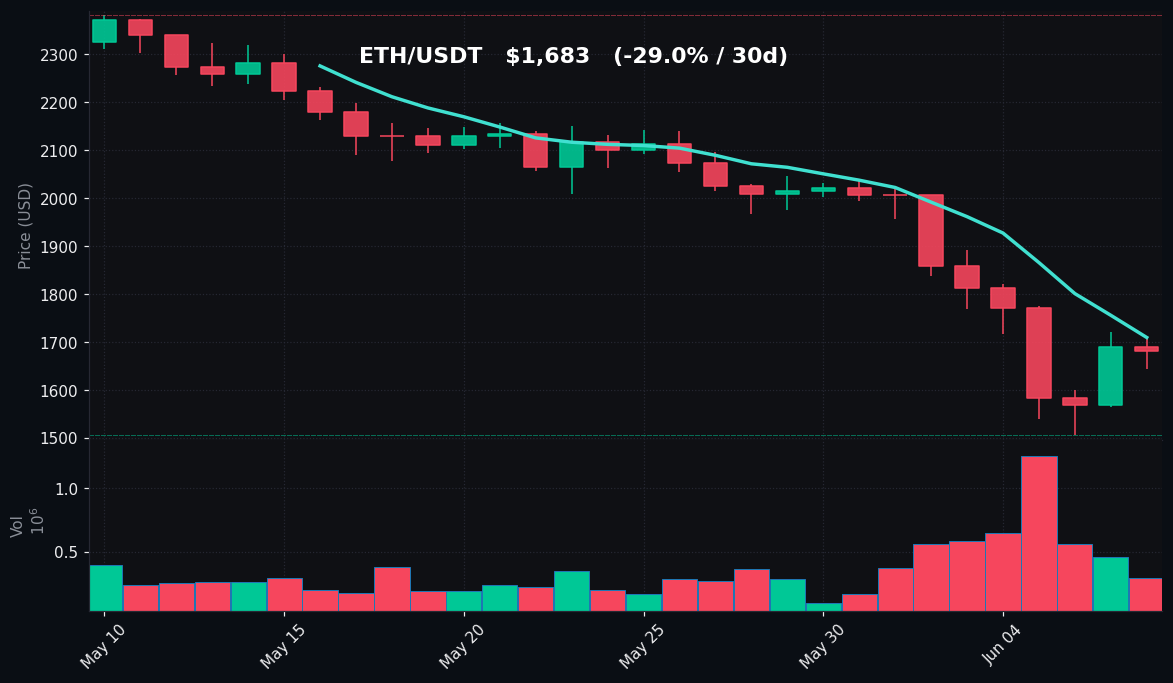
The crypto market continues to face significant downward pressure, with both Bitcoin and Ethereum trading near multi-month lows. Bitcoin (BTC) is currently priced at $63,756, showing a modest 24-hour gain of +0.67% after bouncing from a daily low of $62,408, yet remains deeply entrenched in a bearish trend with a 7-day decline of -10.72% and a 30-day drop of -22.45%. Ethereum (ETH) is struggling more acutely, trading at $1,683 with a 24-hour loss of -0.46%, a 7-day decline of -16.15%, and a 30-day plunge of -29.04%. Both assets are hovering near oversold territory, with BTC’s RSI(14) at an extreme 16.3 and ETH’s at 19.1. Volume across both assets is notably low—less than half of their 7-day averages—suggesting a lack of conviction in the current price action. The broader market remains cautious as key support levels are tested.
Bitcoin Analysis
TradingView Live (4h)
Bitcoin’s technical landscape is dominated by a severe downtrend that has intensified over the past month. The current price of $63,756 sits below both its 7-day moving average (MA7) of $63,403 and its 30-day moving average (MA30) of $73,850, a bearish configuration where short-term momentum remains negative. The MA30 is acting as significant overhead resistance, with the price trading roughly 13.6% below this level. The 7-day high of $71,409—recorded just days ago—now marks a key resistance zone, while the 7-day low of $59,131 represents the most recent critical support level that held during the selloff.
The Relative Strength Index (RSI) at 16.3 is a standout data point: this is an extreme oversold reading, the lowest in recent memory. Typically, RSI below 30 signals oversold conditions, and a reading below 20 suggests a potential exhaustion of selling pressure. However, in the context of a strong downtrend, such low RSI values can persist as prices continue to grind lower, especially given the current volume environment. Trading volume today is 0.42x the 7-day average, indicating reduced participation and a lack of aggressive buying to confirm any reversal. The intraday range—from $62,408 to $63,944—is narrow relative to recent volatility, suggesting a period of consolidation or indecision.
Key technical levels to watch include immediate support at $62,408 (today’s low) and the more critical $59,131 (7-day low). A break below $59,131 would open the door to testing the psychological $50,000 level, which aligns with the 30-day low. On the upside, resistance is stacked at $63,944 (today’s high), $71,409 (7-day high), and the MA30 at $73,850. The price action today shows a slight bounce from the low, but without volume, this cannot be interpreted as a reversal signal. The market is in a clear bearish phase, with sellers in control and buyers hesitant.
Ethereum Analysis
TradingView Live (4h)
Ethereum’s situation is more dire than Bitcoin’s, reflecting a broader risk-off sentiment in altcoins. ETH is trading at $1,683, having lost -16.15% over the past week and -29.04% over the past month. The price is well below both its MA7 of $1,710 and its MA30 of $2,037, with the MA30 now acting as a formidable resistance level approximately 21% above the current price. The 7-day high of $2,007 highlights the speed of the recent decline, while the 7-day low of $1,506 marks a level that has not been tested since the depths of the 2022 bear market.
The RSI(14) at 19.1 is also in deeply oversold territory, even more extreme than Bitcoin’s. This reading suggests that selling pressure has been intense and that ETH is potentially undervalued on a short-term basis. However, similar to BTC, the volume is weak—0.46x the 7-day average—indicating that the current price action lacks conviction. The intraday range of $1,645 to $1,712 is tight, reflecting a market that is catching its breath after the recent selloff but has not yet attracted significant buying interest.
Key support levels for ETH are $1,645 (today’s low), $1,506 (7-day low), and the psychological $1,500 round number. A break below $1,506 would mark a new multi-year low and likely trigger further downside toward $1,400. Resistance levels include $1,712 (today’s high), $1,710 (MA7), $2,007 (7-day high), and the MA30 at $2,037. The MA7 is acting as immediate resistance, with the price unable to reclaim it during today’s session. Ethereum’s correlation with Bitcoin remains high, but its larger percentage losses suggest that traders are more aggressively de-risking altcoin positions in the current environment.
Key Technical Levels
| Asset | Support | Resistance | RSI |
|---|---|---|---|
| BTC | $62,408 (daily low), $59,131 (7-day low) | $63,944 (daily high), $71,409 (7-day high), $73,850 (MA30) | Oversold (16.3) |
| ETH | $1,645 (daily low), $1,506 (7-day low) | $1,712 (daily high), $2,007 (7-day high), $2,037 (MA30) | Oversold (19.1) |
BTC vs ETH Dynamic
The correlation between Bitcoin and Ethereum remains strong in this downturn, as both assets are trading in lockstep within a bearish macro environment. However, Ethereum is underperforming Bitcoin significantly: over the past 30 days, ETH has lost -29.04% versus BTC’s -22.45%, and over the past 7 days, ETH’s -16.15% decline nearly doubles BTC’s -10.72%. This divergence is typical in risk-off periods when investors rotate out of higher-beta altcoins into the relative safety of Bitcoin. The ETH/BTC ratio is trending lower, indicating that Bitcoin is acting as a store of value relative to Ethereum. Both assets are in oversold territory, but ETH’s more extreme percentage losses suggest it may be more vulnerable to further downside if selling pressure continues. The low volume environment across both assets suggests that any sharp move—up or down—could be amplified due to thin liquidity.
Strategy Fit
Given the current market conditions—extreme oversold readings, low volume, and a clear downtrend—the most suitable strategies are those that capitalize on range-bound movement or accumulate positions at discounted levels without attempting to time the bottom. Grid trading is particularly well-suited for this environment: with BTC trading in a narrow intraday range ($62,408–$63,944) and ETH in a similarly tight band ($1,645–$1,712), a neutral grid bot can profit from small price oscillations by placing buy and sell orders within a defined range. Pionex’s grid trading bot allows users to set parameters around these support and resistance levels, automating the process of buying low and selling high in a sideways or consolidating market.
Dollar-cost averaging (DCA) is another logical approach, as the current prices are near multi-month lows. A DCA bot, such as Pionex’s Infinity Grid or DCA bot, can systematically accumulate BTC and ETH at these discounted levels, reducing the risk of a single entry point. This strategy is ideal for investors with a longer time horizon who believe the current oversold conditions represent a buying opportunity, not a reason to panic sell.
Trend-following strategies are not recommended in this environment. The RSI readings are so extreme that chasing the downtrend carries significant risk of a sharp reversal, while attempting to catch a falling knife is equally dangerous. The low volume suggests that the market lacks the momentum for a sustained trend in either direction. Instead, a neutral or accumulation-focused approach is most prudent. Pionex’s built-in bots, including grid trading and DCA, are well-suited to execute these strategies automatically, removing emotional decision-making during volatile periods.
Risk Disclaimer
This market recap is for informational and educational purposes only and does not constitute financial advice, investment recommendations, or solicitation to buy or sell any cryptocurrency. Cryptocurrency markets are highly volatile and involve substantial risk, including the potential loss of principal. Past performance is not indicative of future results. The technical analysis and strategies discussed herein are based on historical data and should not be relied upon as a guarantee of future market behavior. Always conduct your own research and consult with a qualified financial advisor before making any investment decisions. The author and publisher are not responsible for any financial losses incurred as a result of acting on the information provided.
FAQ
Q: What does an RSI of 16.3 for Bitcoin mean?
A: An RSI (Relative Strength Index) of 16.3 indicates that Bitcoin is in deeply oversold territory. Typically, an RSI below 30 suggests that an asset may be undervalued and due for a potential bounce. However, in strong downtrends, oversold readings can persist for extended periods. This reading is extreme and suggests that selling pressure has been intense, but it does not guarantee an immediate reversal.
Q: Why is Ethereum underperforming Bitcoin so significantly?
A: Ethereum is underperforming Bitcoin primarily due to its higher beta nature—meaning it tends to amplify Bitcoin’s moves. In risk-off environments, investors often rotate from altcoins into Bitcoin as a relative safe haven. Additionally, Ethereum’s larger percentage losses reflect broader market de-risking and lower liquidity in altcoin pairs.
Q: Is low volume a bullish or bearish signal?
A: Low volume (BTC at 0.42x and ETH at 0.46x of their 7-day averages) is generally a neutral-to-bearish signal in the context of a downtrend. It suggests that the current price action lacks conviction from either buyers or sellers. Without volume, any potential reversal is less reliable, and the market may remain in a consolidation phase until a catalyst emerges.
Q: What are the key support levels to watch for Bitcoin and Ethereum?
A: For Bitcoin, immediate support is at $62,408 (today’s low) and the critical level at $59,131 (7-day low). For Ethereum, support is at $1,645 (today’s low) and $1,506 (7-day low). A break below these levels could trigger further downside toward $50,000 for BTC and $1,400 for ETH.
Q: What trading strategy is best for this market environment?
A: Grid trading or dollar-cost averaging (DCA) strategies are most appropriate given the extreme oversold conditions and low volume. Grid trading profits from price oscillations within a range, while DCA accumulates positions at discounted levels. Trend-following strategies are not recommended due to the lack of clear momentum and the risk of sharp reversals.