BTC ETH Daily Recap — June 30, 2026: Oversold Territory Intensifies as Bears Consolidate Gains

BTC ETH Daily Recap — June 30, 2026: Oversold Territory Intensifies as Bears Consolidate Gains
Today at a Glance
The cryptocurrency market concluded June 2026 on a deeply bearish note, with both Bitcoin and Ethereum extending their weekly and monthly losses. Bitcoin (BTC) fell 2.12% over the past 24 hours to settle at $58,982, marking a new 30-day low of $58,115 and a 7-day decline of 5.98%. The asset’s 30-day performance now stands at -17.40%, reflecting sustained selling pressure. Ethereum (ETH) underperformed further, dropping 2.59% in the same period to $1,571, with a 30-day loss of 21.70%. Both assets are trading well below their respective 7-day and 30-day moving averages, with RSI(14) readings plunging into oversold territory—23.8 for BTC and 24.1 for ETH. Trading volumes are significantly below their 7-day averages (0.57x for BTC, 0.49x for ETH), suggesting a lack of conviction from either buyers or sellers despite the sharp declines. The market remains in a clear downtrend, with no immediate signs of reversal.
Bitcoin Analysis
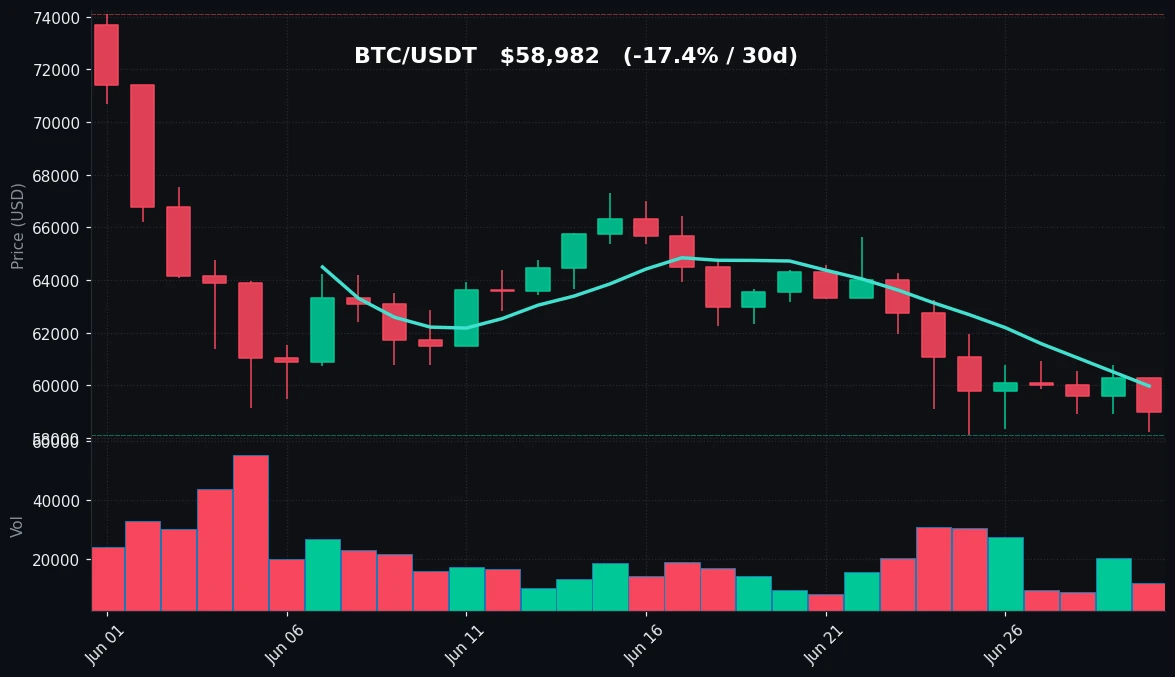
TradingView Live (4h)
Bitcoin’s price action on June 30, 2026, is characterized by a continuation of the bearish trend that has dominated the past 30 days. The asset opened the session near $60,277 (the daily high) but quickly succumbed to selling pressure, closing at $58,982—just above the intraday low of $58,228. This marks the lowest close since mid-May 2026 and reinforces the breakdown below key moving averages. The 7-day moving average (MA7) sits at $59,974, while the 30-day moving average (MA30) is at $63,080, both acting as overhead resistance. The price is now trading approximately 1.7% below MA7 and 6.5% below MA30, indicating a bearish alignment where short-term momentum lags longer-term averages.
The 7-day high/low range of $63,239 to $58,115 shows that Bitcoin has failed to reclaim any significant ground since the weekly peak, with the current price closer to the lower bound. The 30-day high of $74,092, recorded in early June, now seems distant, and the 30-day low of $58,115 was retested intraday on June 30. This level may serve as a near-term support, but its repeated testing without a strong bounce suggests vulnerability.
Volume analysis reveals a critical concern: the 24-hour trading volume is only 0.57 times the 7-day average. This is a classic sign of exhaustion selling, where price moves lower on declining participation. Typically, such conditions can precede either a capitulation event (spike in volume with a sharp drop) or a stabilization phase. However, the absence of aggressive buying means the path of least resistance remains downward.
The RSI(14) reading of 23.8 is deeply oversold—below the 30 threshold that often signals a potential bounce. Historically, Bitcoin has seen short-term reversals when RSI drops below 25, but sustained oversold conditions in a bear market can persist longer. The current reading indicates that selling pressure has been extreme relative to recent price action, but without volume confirmation, a reversal is not guaranteed. Key technical levels to watch: support at $58,115 (30-day low) and $57,500 (psychological level); resistance at $59,974 (MA7) and $60,277 (daily high). A break below $58,115 could open the door to $56,000, while a reclaim of $60,000 would be the first sign of stabilization.
Ethereum Analysis
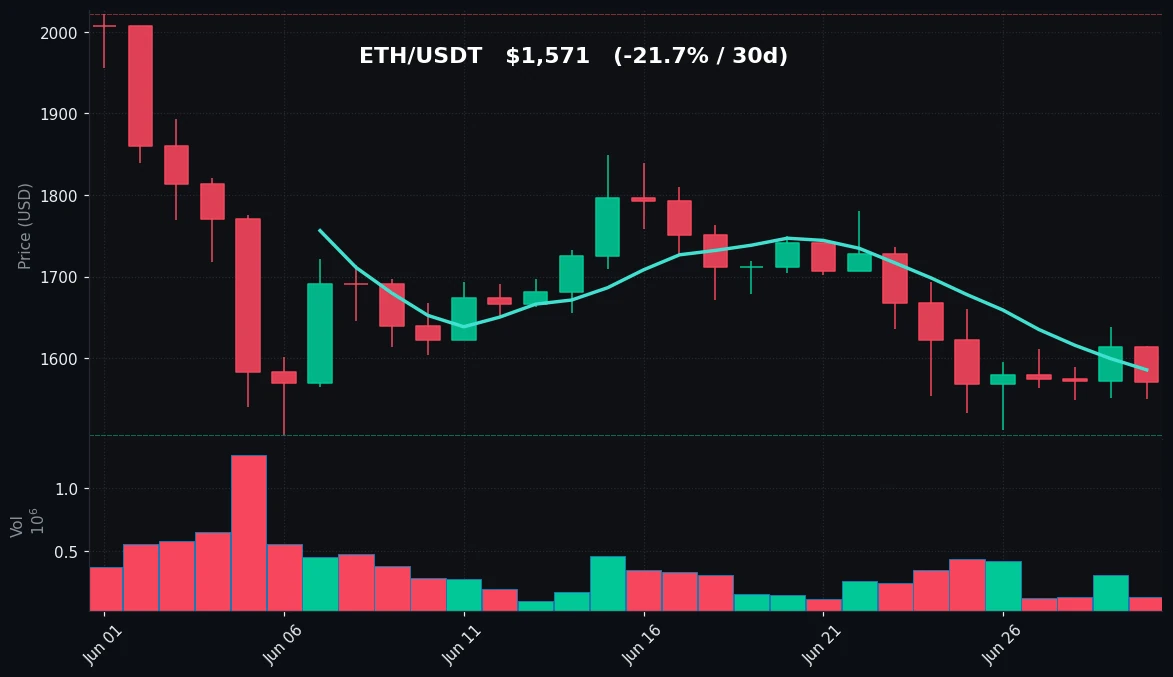
TradingView Live (4h)
Ethereum’s performance on June 30, 2026, mirrors Bitcoin’s weakness but with greater magnitude over the longer timeframe. ETH fell 2.59% to $1,571, with a daily range of $1,614 (high) to $1,550 (low). The 7-day decline of 5.75% is slightly less severe than BTC’s, but the 30-day loss of 21.70% is notably worse, reflecting Ethereum’s higher beta to market downturns. The asset is trading below both its MA7 ($1,586) and MA30 ($1,690), with a bearish crossover evident as the short-term average remains below the longer-term one.
The 7-day high of $1,694 and low of $1,512 show a wide range, with the current price near the midpoint. The 30-day high of $2,022 (from early June) represents a 22% decline to current levels, while the 30-day low of $1,506 has not been breached—yet. This level, tested on June 26, is a critical support; a close below it could trigger further selling toward $1,450. The intraday low of $1,550 on June 30 is just above this support, suggesting that bears are probing but have not yet broken through.
Volume data is even more concerning for ETH than BTC. The 24-hour volume is only 0.49 times the 7-day average, indicating that the selling is occurring on very low participation. This is typical for a market that is “drifting” lower rather than experiencing panic selling. In such conditions, price can move sluggishly but remain vulnerable to sudden drops if any catalyst emerges. The low volume also means that any potential bounce may lack the buying interest to sustain upward momentum.
The RSI(14) reading of 24.1 is also deeply oversold, just above the 24 threshold. Like Bitcoin, this suggests that short-term selling has been extreme, but the lack of volume confirmation means that a reversal is not imminent. Historically, Ethereum has seen sharp bounces from RSI levels below 25, but these often require a catalyst (e.g., positive news or a broader market rally) to materialize. Key technical levels: support at $1,506 (30-day low) and $1,450 (psychological); resistance at $1,586 (MA7) and $1,614 (daily high). A break below $1,506 would likely accelerate selling, while a move above $1,600 would be the first step toward recovery.
Key Technical Levels
| Asset | Support | Resistance | RSI |
|---|---|---|---|
| BTC | $58,115 | $60,277 | oversold |
| ETH | $1,506 | $1,614 | oversold |
BTC vs ETH Dynamic
The correlation between Bitcoin and Ethereum remains high, with both assets moving in lockstep during this bearish phase. Over the past 24 hours, BTC’s decline of 2.12% was slightly less severe than ETH’s 2.59%, but the 7-day performance shows BTC (-5.98%) underperforming ETH (-5.75%) marginally. However, over 30 days, ETH’s 21.70% loss is significantly worse than BTC’s 17.40%, reflecting Ethereum’s higher volatility and larger drawdowns during downtrends. The RSI readings are nearly identical (23.8 vs. 24.1), confirming that both assets are experiencing similar selling pressure. The volume discrepancy (BTC at 0.57x vs. ETH at 0.49x of their respective 7-day averages) suggests that Ethereum’s decline is occurring on even lower participation, making it more susceptible to sharp moves. In the current environment, any recovery in BTC is likely to lead ETH higher, but the opposite is also true—a further breakdown in BTC would likely drag ETH to new lows. The market is clearly in a risk-off mode, with no divergence between the two leading cryptocurrencies.
Strategy Fit
Given the current market conditions—deeply oversold RSI, declining volume, and sustained downtrends—the most appropriate trading strategies are defensive and mean-reversion oriented. Grid trading on Pionex is particularly well-suited for this environment, as it allows traders to profit from range-bound price movements without predicting direction. For BTC, a grid set between $58,000 and $60,500 could capture the expected consolidation around current levels, while for ETH, a grid between $1,500 and $1,620 would align with the near-term support and resistance. The low volume suggests that extreme volatility is unlikely in the immediate term, making grid strategies less risky than during high-volatility periods.
Dollar-cost averaging (DCA) is another prudent strategy, especially for long-term holders. With both assets at 30-day lows and RSI in oversold territory, accumulating positions gradually can reduce the impact of further downside. Pionex’s DCA bot allows users to set recurring buys, which can be adjusted to increase frequency during dips. However, traders should be cautious not to deploy full capital, as the trend remains bearish and the 30-day moving averages are still declining.
Trend-following strategies are not recommended at this juncture, as the market lacks a clear directional bias (low volume suggests indecision). The oversold RSI could lead to a short-term bounce, but the overall trend is down, making trend-following risky. Instead, traders may consider reversal strategies using Pionex’s futures grid or spot-futures arbitrage bots, but only with strict stop-losses. The key is to avoid chasing the downside and instead wait for confirmation of a reversal (e.g., a daily close above MA7 or a volume spike). In summary, grid trading and DCA are the most fitting approaches for June 30, 2026, given the oversold but low-volume conditions.
Risk Disclaimer
This market recap is for informational and educational purposes only and does not constitute financial advice. Cryptocurrency trading involves substantial risk, including the potential loss of principal. Past performance and technical indicators are not guarantees of future results. The data and analysis presented are based on publicly available information as of June 30, 2026, and may not reflect real-time market conditions. Trading decisions should be made based on your own research, risk tolerance, and financial situation. Always consider consulting a qualified financial advisor before engaging in any trading activity. The author and platform are not responsible for any losses incurred from trading based on this content.
FAQ
Q: Why are BTC and ETH both in oversold territory?
A: The RSI(14) readings of 23.8 (BTC) and 24.1 (ETH) indicate that both assets have experienced significant selling pressure over the past 14 days, pushing them into oversold territory. This is often a sign that the market is due for a potential bounce, but it can also persist in a strong downtrend.
Q: What does low volume mean for the current market?
A: Volume for BTC (0.57x of 7-day average) and ETH (0.49x) is well below normal. Low volume during a decline suggests that selling is not aggressive, but also that buying interest is weak. This can lead to “drift” lower or sudden moves if any catalyst appears.
Q: Is $58,115 a strong support for Bitcoin?
A: Yes, $58,115 is the 30-day low and has been tested multiple times in the past week. If it holds, it could serve as a base for a bounce. However, a close below this level would likely trigger further selling toward $56,000 or lower.
Q: How does Ethereum’s performance compare to Bitcoin’s over 30 days?
A: Ethereum has underperformed Bitcoin significantly, with a 30-day loss of 21.70% versus Bitcoin’s 17.40%. This reflects Ethereum’s higher volatility and its tendency to amplify both gains and losses during market moves.
Q: What trading strategies are best for this market?
A: Grid trading and dollar-cost averaging (DCA) are most suitable given the oversold but low-volume conditions. Trend-following is not recommended due to the lack of clear direction. Pionex offers automated bots for both grid and DCA strategies to help manage risk.


