BTC ETH Daily Recap – June 3, 2026
BTC ETH Daily Recap – June 3, 2026
Today at a Glance
On June 3, 2026, both Bitcoin and Ethereum showed marginal intraday gains, but the broader picture remains heavily bearish. Bitcoin (BTC) traded at $66,771, up just +0.01% in the last 24 hours, with a daily range between $65,426 and $67,516. The asset has shed 10.31% over the past week and 17.47% over the past month, now trading well below its 7-day and 30-day moving averages of $71,368 and $76,948, respectively. Ethereum (ETH) mirrored this stagnation at $1,863, up +0.18% on the day, with a 24-hour range of $1,817 to $1,893. ETH’s weekly decline stands at -7.99%, while the monthly loss deepens to -21.08%. Both assets are trading near their 30-day lows, with RSI readings deep into oversold territory—BTC at 14.9 and ETH at 19.5. Volume remains near average, suggesting no panic selling or aggressive accumulation yet. The market is in a clear downtrend, with no signs of reversal from current technical indicators.
Bitcoin Analysis
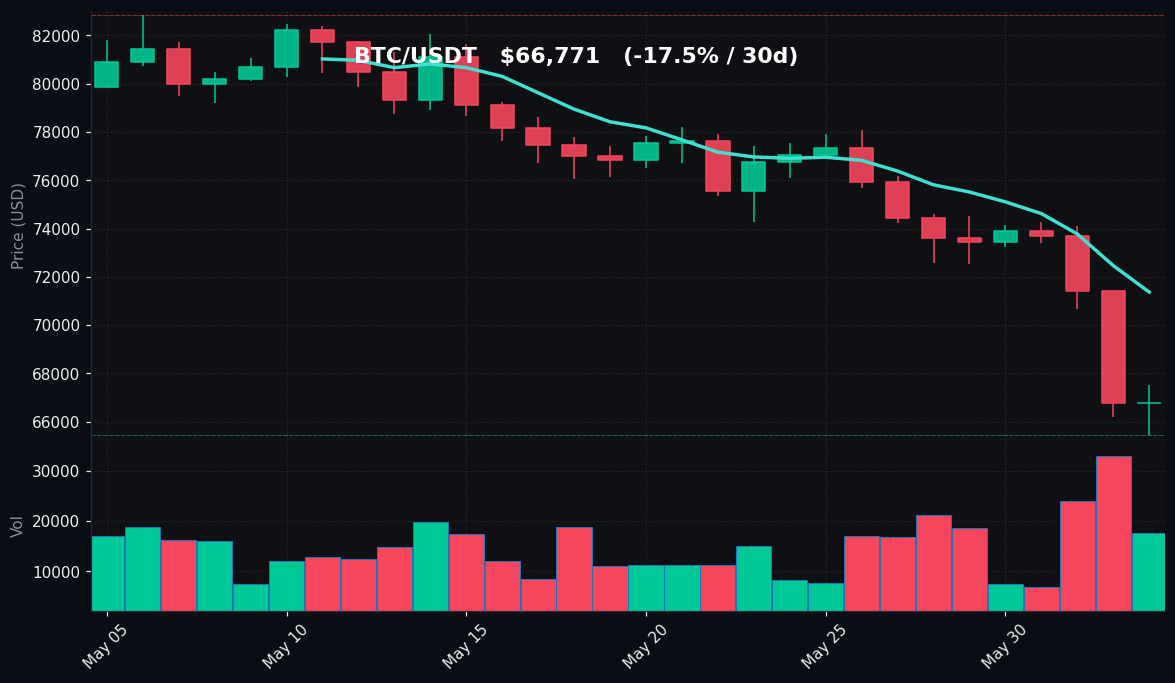
TradingView Live (4h)
Bitcoin’s price action on June 3 reflects a market in prolonged consolidation near its 30-day low of $65,426. The asset opened the day near $66,750 and tested the $67,516 high early in the session before pulling back to current levels. The 24-hour range of $2,090 (from $65,426 to $67,516) indicates moderate volatility, but the lack of directional follow-through suggests indecision among traders. The 7-day moving average (MA7) at $71,368 and the 30-day moving average (MA30) at $76,948 both sit significantly above the current price, confirming a bearish crossover where short-term momentum remains below longer-term averages. This is a classic sign of a downtrend in progress.
The Relative Strength Index (RSI) at 14.9 is extremely oversold—well below the 30 threshold typically considered oversold. Such a low reading is rare and historically precedes either a sharp bounce or continued capitulation. However, volume at 0.96x the 7-day average suggests that selling pressure is not accelerating; rather, it is steady and methodical. This could indicate that the market is absorbing supply without aggressive buying interest. Key support is at the $65,426 low, which has held for the past 24 hours and also marks the 30-day low. A break below this level could open the door to $63,000 or lower. On the upside, resistance is at the MA7 of $71,368, followed by the $74,591 weekly high. Without a catalyst, BTC may continue to grind sideways or lower.
From a technical structure perspective, the 30-day high of $82,850 and the current price represent a decline of over 19%. The lack of any significant recovery bounce after such a drop suggests that the market is not yet finding a bottom. The volume profile is neutral, not indicating a climax sell-off. Traders should monitor the $65,426 level closely; a daily close below it would confirm further downside. Until then, the market remains in a holding pattern with a bearish bias.
Ethereum Analysis
TradingView Live (4h)
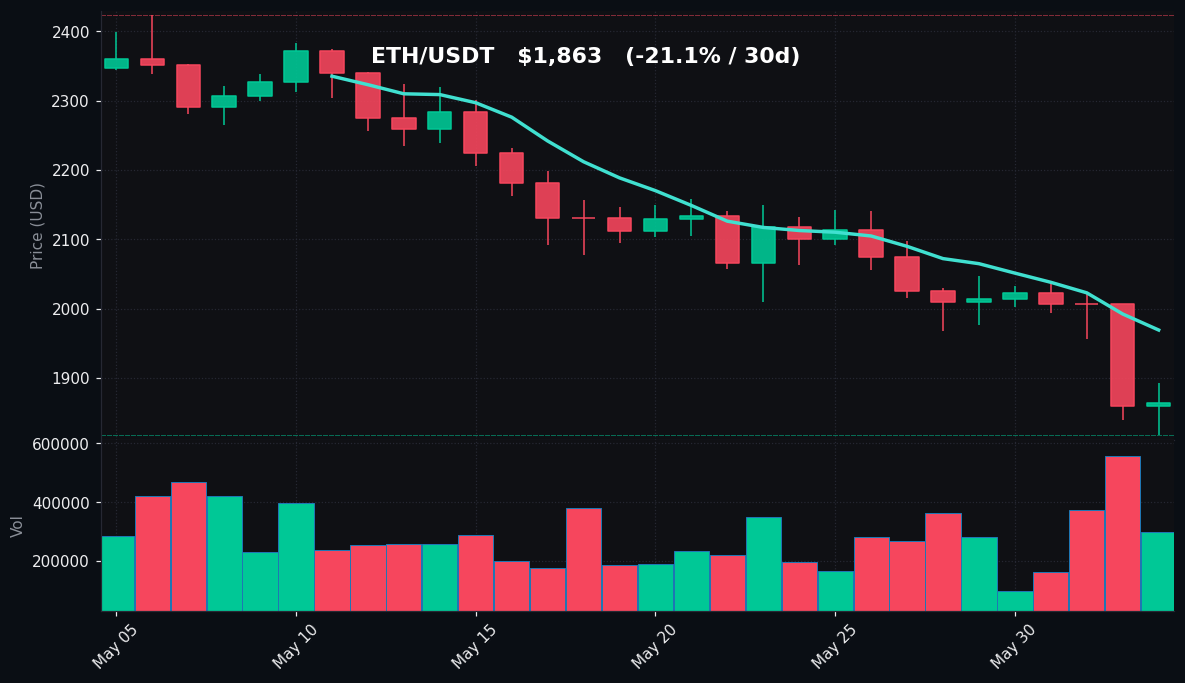
Ethereum’s price action on June 3 is similarly subdued, with the asset trading at $1,863, up just 0.18% on the day. The intraday high of $1,893 was tested but failed to hold, while the low of $1,817 marks the 30-day low and a critical support zone. ETH’s 7-day decline of 7.99% is less severe than BTC’s, but the monthly loss of 21.08% is steeper, indicating that ETH has underperformed BTC over the longer timeframe. The MA7 at $1,969 and MA30 at $2,149 both sit well above the current price, confirming a bearish trend. The gap between price and MA30 ($286 or 13.3%) is significant, suggesting that the asset is deeply discounted relative to its recent average.
The RSI for ETH is 19.5, also in oversold territory but slightly higher than BTC’s. This divergence may indicate that ETH is finding some relative support, though it is still firmly in bearish territory. Volume is exactly at the 7-day average (1.0x), indicating no unusual activity. The lack of volume spike during the drop to $1,817 suggests that selling is orderly rather than panicked. Support at $1,817 is the line in the sand; a break below could target $1,750 or lower. Resistance is at the MA7 of $1,969, followed by the weekly high of $2,047.
ETH’s 30-day range of $2,424 to $1,817 represents a decline of 25%, which is more pronounced than BTC’s 21% drop over the same period. This relative weakness suggests that altcoins, led by ETH, are under more pressure than BTC in the current environment. The oversold RSI could attract dip buyers, but without a catalyst, any bounce may be short-lived. The market is waiting for a trigger—either a macro event or a technical reversal pattern. Until then, ETH is likely to track BTC’s moves with a beta higher than 1.
Key Technical Levels
| Asset | Support | Resistance | RSI |
|---|---|---|---|
| BTC | $65,426 | $71,368 | Oversold (14.9) |
| ETH | $1,817 | $1,969 | Oversold (19.5) |
Support levels are based on the 30-day lows and the MA7 serves as immediate resistance. RSI readings confirm both assets are in deeply oversold conditions, which historically can precede a reversal but do not guarantee one.
BTC vs ETH Dynamic
The correlation between Bitcoin and Ethereum remains strong, with both assets moving in tandem over the past 24 hours. BTC’s 24-hour change of +0.01% and ETH’s +0.18% show near-perfect alignment, though ETH’s slightly larger move reflects its higher beta. Over the past week, BTC has declined 10.31% versus ETH’s 7.99%, indicating that ETH is showing some relative resilience in the short term. However, over the past month, ETH’s 21.08% drop is worse than BTC’s 17.47%, suggesting that the longer-term trend favors BTC as a store of value. The divergence in RSI—14.9 for BTC vs 19.5 for ETH—hints that ETH may be slightly less oversold, but both are in extreme territory. Traders should expect high correlation to continue, with ETH likely to amplify BTC’s moves in either direction.
Strategy Fit
Given the current market conditions—deep oversold readings, low volume, and a clear downtrend—the most suitable strategy is a grid trading approach, specifically a short grid or neutral grid on a platform like Pionex. The extreme RSI levels suggest that a sharp reversal is possible but not guaranteed, making trend-following strategies risky. A grid bot that places buy orders near support ($65,426 for BTC, $1,817 for ETH) and sell orders near resistance ($71,368 for BTC, $1,969 for ETH) can capture volatility without directional bets. Pionex’s Infinity Grid bot is particularly useful here, as it can automatically adjust to new ranges if the market breaks lower.
For more conservative traders, a DCA (Dollar-Cost Averaging) strategy into BTC and ETH at current levels could be considered, given the oversold conditions. However, this requires a longer time horizon and tolerance for further downside. Pionex’s DCA bot can automate this process with fixed intervals. Trend-following strategies are not recommended until a clear breakout above the MA7 levels occurs. The low volume environment also makes momentum strategies unreliable. In summary, grid trading is the best fit for the current sideways-to-bearish market, allowing traders to profit from range-bound moves while managing risk.
Risk Disclaimer
This analysis is for informational and educational purposes only and does not constitute financial advice, investment recommendation, or solicitation to trade. Cryptocurrency markets are highly volatile and involve substantial risk of loss. Past performance is not indicative of future results. Always conduct your own research and consult with a licensed financial advisor before making any trading decisions. The use of automated trading bots, such as those offered by Pionex, does not guarantee profits and may result in losses. Trade responsibly.
FAQ
Q: Why is Bitcoin’s RSI so low at 14.9?
A: An RSI below 30 indicates oversold conditions. A reading of 14.9 is extremely low, meaning the asset has seen sustained selling pressure with little buying interest. This can precede a bounce, but it is not a guaranteed reversal signal.
Q: Should I buy Bitcoin or Ethereum at these levels?
A: This is not a recommendation. Both assets are in a downtrend and oversold. Some traders may see value at these levels, but further downside is possible. Always assess your risk tolerance and use proper position sizing.
Q: What does the volume data tell us about the market?
A: Volume is near the 7-day average for both BTC and ETH, indicating no panic selling or aggressive accumulation. This suggests the market is in a state of equilibrium, with sellers and buyers relatively balanced.
Q: How long can the downtrend continue?
A: Trends can persist longer than expected. The current downtrend has been in place for over 30 days, with both assets making lower highs and lower lows. A reversal would require a catalyst, such as positive macro news or a technical breakout above moving averages.
Q: What is the best trading strategy for these conditions?
A: Grid trading is often suitable in range-bound or slightly trending markets. For the current oversold conditions, a short grid or neutral grid can capture volatility. DCA is also an option for long-term investors. Avoid trend-following until a clear breakout occurs.