BTC ETH Daily Recap — June 28, 2026

BTC ETH Daily Recap — June 28, 2026
Today at a Glance
The crypto market remains under pressure as June draws to a close, with both BTC and ETH trading near multi-week lows. Bitcoin (BTC) is currently at $60,084, posting a marginal 24-hour gain of +0.09%, but the broader trend is decisively bearish with a 7-day decline of -5.10% and a 30-day drop of -18.68%. The intraday range was tight at $59,753–$60,545, reflecting low volatility and subdued participation (volume at just 0.21x the 7-day average). Ethereum (ETH) fared slightly better on the day with a +0.37% gain to $1,580, though its week-over-week performance is weaker at -7.44%. ETH’s 30-day decline of -21.88% highlights a deeper correction relative to BTC. Both assets are trading below their 7-day and 30-day moving averages, with RSI readings in oversold territory (BTC: 25.7, ETH: 32.8), signaling potential exhaustion of selling pressure but no clear reversal catalyst yet. Volume across both markets remains significantly below average, suggesting a lack of conviction from buyers or sellers.
Bitcoin Analysis
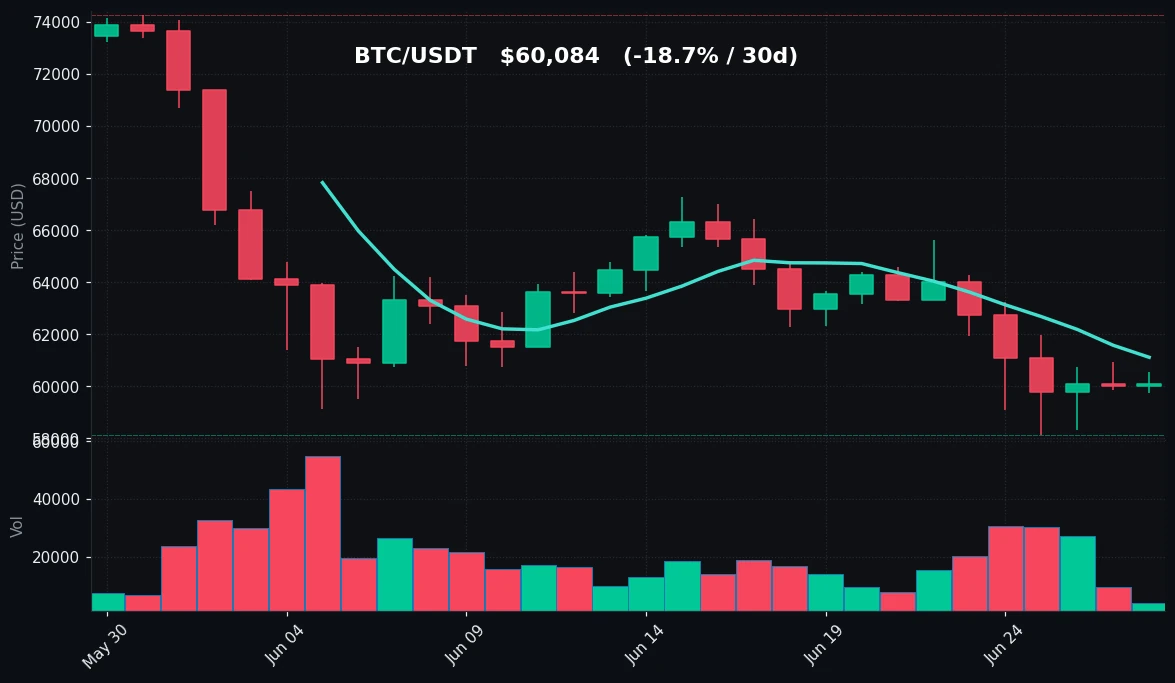
TradingView Live (4h)
Bitcoin’s price action on June 28 reflects a market in consolidation near the lower end of its recent range. After touching a 7-day high of $65,623 on June 21, BTC has since retraced to $60,084, with the 30-day high of $74,276 now a distant memory. The current price sits below both the 7-day moving average (MA7) of $61,120 and the 30-day moving average (MA30) of $64,041, indicating sustained bearish momentum in the short to medium term. The gap between MA7 and MA30 ($61,120 vs. $64,041) is widening, typically a sign of accelerating downside pressure.
The RSI(14) reading of 25.7 places Bitcoin firmly in oversold territory (below 30). Historically, such levels have often preceded short-term bounces or consolidation phases, but they do not guarantee a reversal. The oversold condition suggests that selling has been aggressive and that the asset may be undervalued relative to recent price action, but without a catalyst (e.g., macroeconomic news, regulatory clarity, or institutional inflows), the market may drift sideways or lower.
Volume analysis is particularly telling: the current 24-hour volume is only 0.21x the 7-day average. This is an extreme low-volume environment, often associated with indecision and liquidity gaps. Low volume can amplify price swings in either direction, but it also means that any breakout—up or down—may lack follow-through. The 24-hour range ($59,753–$60,545) is narrow, suggesting that neither bulls nor bears are willing to commit capital at current levels.
Key support is the recent 7-day and 30-day low of $58,115. A break below this level would open the door to further downside toward the psychological $55,000 zone. On the upside, resistance sits at $61,120 (MA7) and then $64,041 (MA30). A reclaim of the MA7 would be the first bullish signal, but a move above $64,041 is needed to shift the near-term trend.
Ethereum Analysis
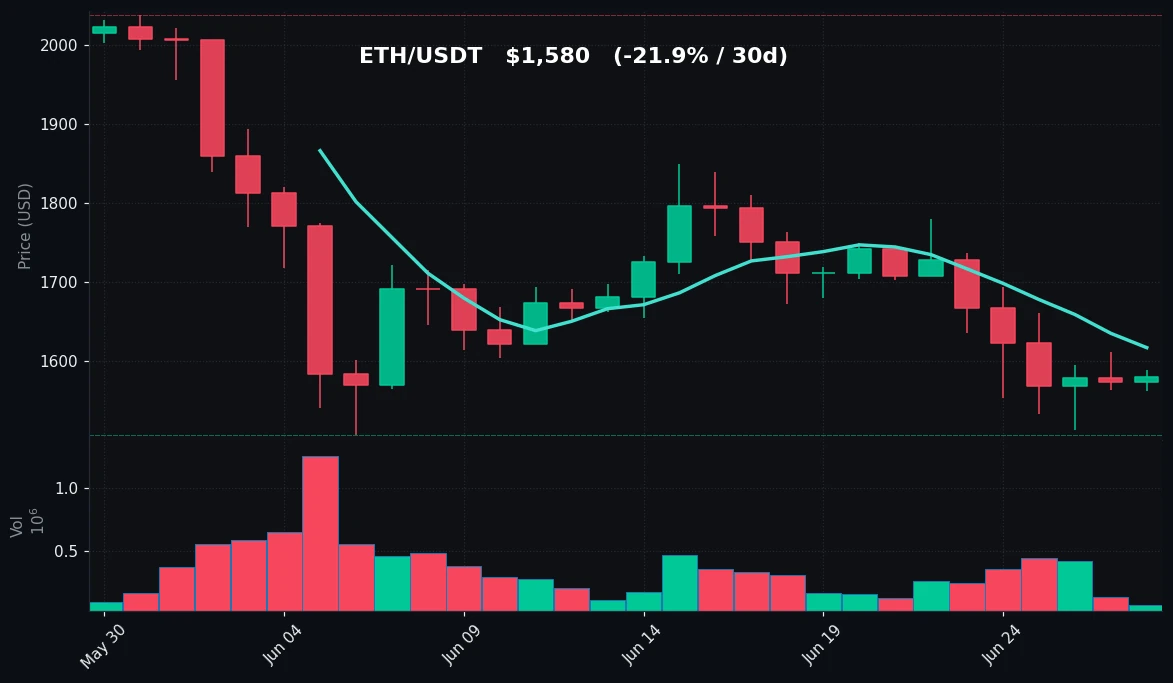
TradingView Live (4h)
Ethereum is trading at $1,580, up +0.37% on the day, but the broader picture is one of persistent weakness. The 7-day decline of -7.44% and 30-day decline of -21.88% are steeper than Bitcoin’s, reflecting ETH’s higher beta to market downturns. The intraday range was narrow ($1,562–$1,589), mirroring BTC’s low-volatility environment. Volume is similarly depressed at 0.25x the 7-day average.
ETH’s technical structure is bearish. The price is below both MA7 ($1,617) and MA30 ($1,718), with the MA30 acting as a significant overhead resistance. The gap between these moving averages is widening, consistent with a downtrend. The 30-day high of $2,038 is now 22.5% above the current price, illustrating the depth of the correction.
The RSI(14) of 32.8 is approaching oversold territory (below 30) but has not yet crossed that threshold. This suggests that selling pressure, while elevated, may have room to continue before reaching the same exhaustion levels as Bitcoin. ETH’s RSI is slightly higher than BTC’s, which could indicate relative strength—or simply that ETH has not been sold off as aggressively in percentage terms today.
Support levels to watch include the 7-day low of $1,512 and the 30-day low of $1,506. A break below $1,500 would be a significant psychological and technical breakdown, likely accelerating selling. Resistance is at $1,617 (MA7) and then $1,718 (MA30). The $1,600–$1,620 zone is a critical near-term battleground.
ETH’s correlation with BTC remains high, but its steeper decline suggests that altcoin sentiment is more fragile. Without a strong catalyst (e.g., Ethereum network upgrades, DeFi activity, or ETF developments), ETH may continue to underperform.
Key Technical Levels
| Asset | Support | Resistance | RSI |
|---|---|---|---|
| BTC | $58,115 | $61,120 | oversold (25.7) |
| ETH | $1,506 | $1,617 | neutral-to-oversold (32.8) |
BTC vs ETH Dynamic
The correlation between Bitcoin and Ethereum remains high, as both assets are trading in lockstep within a bearish macro environment. However, ETH’s 30-day decline of -21.88% versus BTC’s -18.68% indicates that Ethereum is underperforming, a common pattern during risk-off periods when investors favor the more established store-of-value asset. The RSI divergence—BTC at 25.7 (oversold) vs. ETH at 32.8 (neutral-to-oversold)—suggests that Bitcoin may be closer to a short-term bottom, while ETH could see further downside. Volume patterns are similar: both are experiencing extremely low participation (0.21x and 0.25x of 7-day averages), indicating that the market is waiting for a directional catalyst rather than driving one.
Strategy Fit
Given the current low-volatility, low-volume environment with both assets in oversold or near-oversold territory, a grid trading strategy is particularly well-suited. The narrow intraday ranges ($59,753–$60,545 for BTC, $1,562–$1,589 for ETH) provide opportunities to profit from small price oscillations. Pionex’s built-in grid bots can automatically place buy and sell orders within a defined range, capturing profits from each fluctuation without requiring constant monitoring. For BTC, a grid range of $58,000–$62,000 would capture the current support and resistance levels. For ETH, a range of $1,500–$1,650 would be appropriate.
Dollar-cost averaging (DCA) is also a valid approach for longer-term accumulation, given the oversold RSI readings. However, DCA works best in trending markets or when volatility is expected to increase, which is not the case today. Trend-following strategies are not recommended, as there is no clear trend—both assets are in a downtrend but showing signs of exhaustion. Grid trading offers the best risk-reward profile in this sideways, low-volatility environment. Pionex’s infinity grid or reverse grid bots can also be considered if a breakout occurs, but the current data suggests range-bound action is more likely.
Risk Disclaimer
This market recap is for informational and educational purposes only and does not constitute financial advice, investment recommendation, or solicitation to buy or sell any asset. Cryptocurrency markets are highly volatile and involve substantial risk. Past performance is not indicative of future results. Always conduct your own research and consult with a licensed financial advisor before making any investment decisions.
FAQ
Q: Why is BTC’s RSI at 25.7 considered oversold?
A: The Relative Strength Index (RSI) measures the magnitude of recent price changes. A reading below 30 is traditionally considered oversold, indicating that selling may have been excessive and a price bounce or consolidation could occur. However, oversold conditions can persist in strong downtrends.
Q: Is low volume a bullish or bearish signal?
A: Low volume can be interpreted both ways. It may indicate that selling pressure is exhausted (bullish) or that buyers are absent (bearish). In the current context, BTC and ETH volume at ~0.2x the 7-day average suggests indecision and a lack of catalyst, making the market vulnerable to sharp moves in either direction.
Q: What are the key levels to watch for BTC and ETH?
A: For BTC, support is at $58,115 (recent low) and resistance at $61,120 (MA7). A break below $58,115 could lead to $55,000. For ETH, support is at $1,506 (30-day low) and resistance at $1,617 (MA7). A break below $1,500 would be a significant bearish signal.
Q: How does Bitcoin’s performance compare to Ethereum’s over the past month?
A: Bitcoin has declined -18.68% over 30 days, while Ethereum has fallen -21.88%. ETH’s larger decline reflects its higher volatility and sensitivity to risk-off sentiment. BTC remains relatively stronger in percentage terms.
Q: What trading strategies are suitable for this market environment?
A: Grid trading is ideal for the current low-volatility, range-bound conditions. Pionex’s grid bots can automate buy-low/sell-high orders within a defined price range. DCA is also an option for long-term accumulation, but trend-following strategies are not recommended due to the lack of a clear directional move.


