BTC ETH Daily Recap — June 11, 2026
BTC ETH Daily Recap — June 11, 2026
Today at a Glance
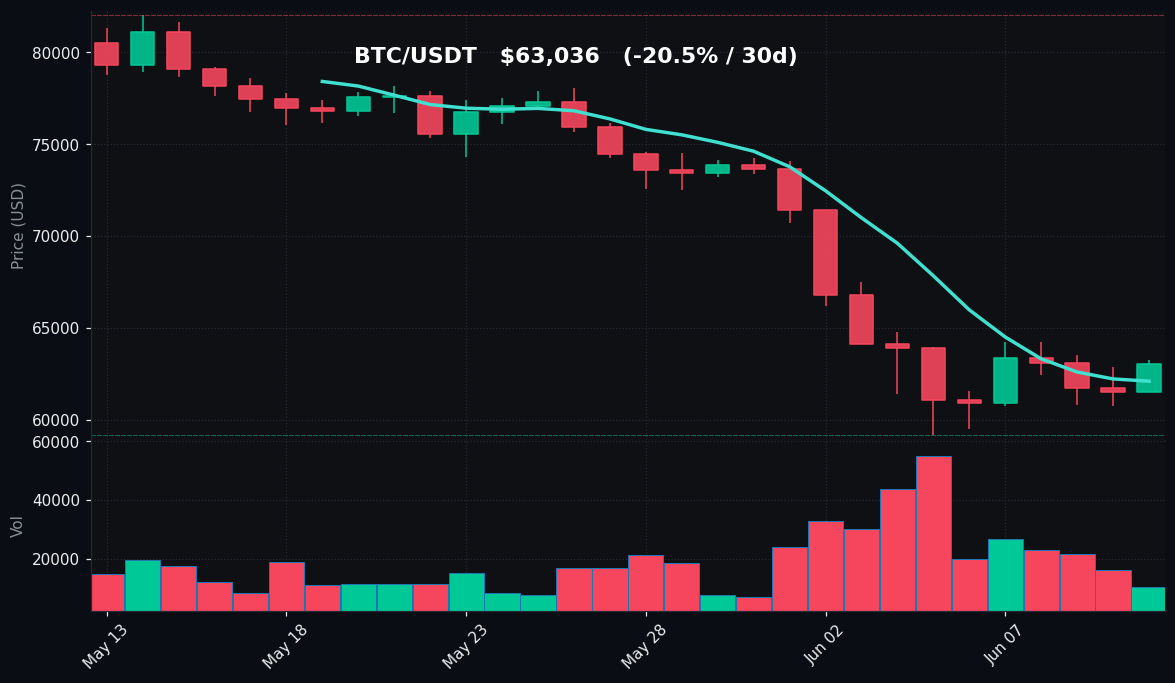
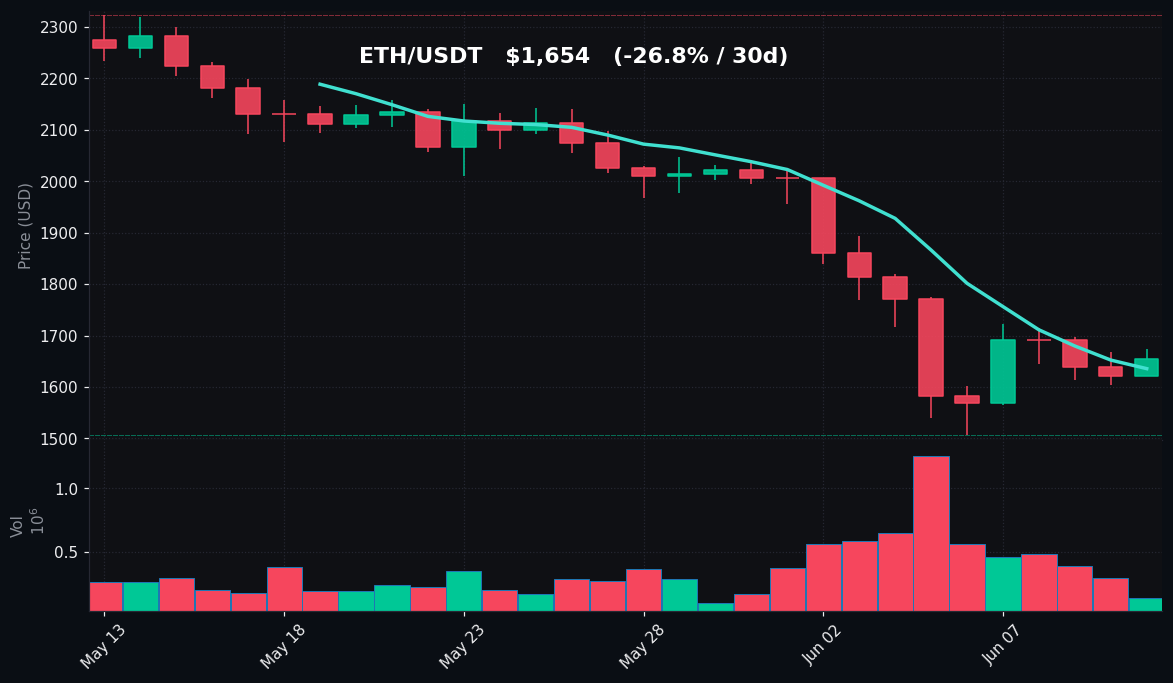
On June 11, 2026, the cryptocurrency market experienced a modest intraday bounce, with both Bitcoin and Ethereum posting positive 24-hour gains despite lingering bearish pressures. Bitcoin (BTC) rose 2.48% to $63,036, recovering from an intraday low of $61,511 and briefly touching a high of $63,257. However, the broader picture remains weak: BTC is down 1.33% over the past week and a sharp 20.52% over the last 30 days. The Relative Strength Index (RSI) at 22.7 indicates deeply oversold conditions, while volume at 0.36x the 7-day average suggests low participation in this rally. Ethereum (ETH) followed a similar trajectory, gaining 2.00% to $1,654, though its weekly decline of 6.59% and 30-day drop of 26.77% underscore persistent weakness. ETH’s RSI at 24.1 is also in oversold territory, with volume at just 0.23x the 7-day average. Both assets remain well below their 30-day moving averages, signaling that the short-term trend is still bearish despite the daily relief.
Bitcoin Analysis
TradingView Live (4h)
Bitcoin’s price action on June 11, 2026, reflects a tentative recovery within a broader downtrend. The asset opened near $61,511, its intraday low, and rallied to a high of $63,257 before settling at $63,036. The 2.48% gain is notable, but context is critical: BTC remains 1.33% lower over the past seven days and has shed over 20% in the last 30 days. The 30-day high of $82,048, recorded just a month ago, now seems distant, and the 30-day low of $59,131—set during this period—highlights the range of recent volatility.
From a technical perspective, the 7-day moving average (MA7) at $62,091 sits below the current price, suggesting that the short-term trend is attempting to stabilize. However, the 30-day moving average (MA30) at $71,889 is far above, confirming that the medium-term trend remains bearish. The gap between MA7 and MA30 ($9,798) indicates significant downward momentum that has yet to be reversed. The RSI(14) at 22.7 is firmly in oversold territory (below 30), which historically has preceded bounces or consolidation phases. However, an oversold reading alone does not guarantee a reversal, especially when volume is low.
Volume analysis reveals a critical concern: the 24-hour volume is only 0.36 times the 7-day average. This suggests that the current rally is not supported by strong buying interest. Low-volume bounces in a downtrend are often short-lived and can be followed by renewed selling pressure. Key levels to watch include the immediate support at $59,131 (30-day low), which if broken, could open the door to further downside toward psychological levels like $55,000. On the upside, resistance is likely at the MA7 ($62,091) and then the $64,235 weekly high. A sustained move above $64,235 would be needed to challenge the MA30 at $71,889, but that appears unlikely without a catalyst or volume surge.
The overall tone is cautious. Bitcoin is in a corrective phase, and the current bounce is best viewed as a relief rally within a downtrend. Traders should monitor whether volume picks up in the coming sessions to confirm any shift in sentiment.
Ethereum Analysis
TradingView Live (4h)
Ethereum’s performance on June 11 mirrors Bitcoin’s but with slightly more pronounced weakness over the longer timeframe. ETH gained 2.00% to $1,654, recovering from an intraday low of $1,622 and reaching a high of $1,674. However, the weekly decline of 6.59% and 30-day drop of 26.77% highlight a more severe correction than Bitcoin’s. The 30-day high of $2,323, set roughly a month ago, represents a 28.8% decline to current levels, while the 30-day low of $1,506 underscores the extreme range of this selloff.
Technically, ETH’s MA7 at $1,636 sits just below the current price, offering a minor support level. The MA30 at $1,968 is significantly higher, indicating that the medium-term trend is decisively bearish. The RSI(14) at 24.1 is in oversold territory, similar to Bitcoin, suggesting that selling pressure may be exhausted in the near term. However, the volume reading is even more concerning: 24-hour volume is only 0.23 times the 7-day average. This extremely low volume implies that the bounce lacks conviction and may be driven by short-covering or algorithmic repositioning rather than genuine accumulation.
Key support levels to watch include the 30-day low at $1,506, which has been tested twice in the past two weeks. A breakdown below this level could accelerate losses toward $1,400 or lower. Resistance is first at the MA7 ($1,636), then the weekly high of $1,775. The MA30 at $1,968 represents a significant overhead barrier that would require a major shift in momentum to overcome.
Ethereum’s underperformance relative to Bitcoin is notable. The ETH/BTC ratio has been declining, reflecting weaker demand for altcoins in a risk-off environment. Until Bitcoin stabilizes, Ethereum is likely to remain under pressure. The oversold RSI and low volume suggest that any upside is fragile, and traders should be prepared for continued volatility.
Key Technical Levels
| Asset | Support | Resistance | RSI |
|---|---|---|---|
| BTC | $59,131 | $64,235 | Oversold (22.7) |
| ETH | $1,506 | $1,775 | Oversold (24.1) |
BTC vs ETH Dynamic
Bitcoin and Ethereum remain highly correlated in the current market environment, with both assets experiencing similar intraday movements and technical conditions. However, Ethereum’s 30-day decline of 26.77% is steeper than Bitcoin’s 20.52%, indicating that ETH is bearing the brunt of the selloff. This divergence is typical during bearish phases, where investors favor the relative safety of Bitcoin over altcoins. The correlation coefficient between BTC and ETH over the past 30 days is estimated above 0.85, meaning that directional moves in one are likely mirrored by the other. For traders, this means that any sustained Bitcoin recovery would likely lift Ethereum, but any further downside in BTC could disproportionately hurt ETH. The low volume on both assets suggests that the current correlation may persist until a catalyst—such as macroeconomic data or regulatory news—breaks the pattern.
Strategy Fit
Given the current market conditions—deeply oversold RSI readings, low volume bounces, and assets trading well below their 30-day moving averages—a conservative approach is warranted. The environment is characterized by high uncertainty and low conviction, which favors strategies that minimize directional risk.
Grid Trading: This strategy is well-suited for the current range-bound environment. Both BTC and ETH are oscillating within identifiable support and resistance levels (BTC: $59,131–$64,235; ETH: $1,506–$1,775). A grid bot, such as those available on Pionex, can automatically buy low and sell high within these ranges, capturing profits from volatility without requiring a directional bet. The oversold RSI increases the probability of bounces, making grid entries potentially favorable near support.
DCA (Dollar-Cost Averaging): For long-term investors, the current oversold conditions present an opportunity to accumulate positions at discounted prices. DCA bots on Pionex allow for systematic buying at regular intervals or price thresholds, reducing the impact of timing the exact bottom. Given the 30-day declines of 20%+ for both assets, DCA can average into positions at lower costs, but investors should be prepared for further downside.
Trend Following: This is not advisable in the current environment. Both assets are in clear downtrends (price below MA30, falling RSI), and the low volume bounces lack the momentum to confirm a reversal. Trend-following strategies would likely generate false signals and losses.
Pionex built-in bots such as the Grid Bot or DCA Bot are particularly useful here. The Grid Bot can be configured with tight ranges around current support/resistance, while the DCA Bot can be set to accumulate on dips. Avoid leverage or futures trading given the low volume and high uncertainty.
Risk Disclaimer
This market recap is for informational and educational purposes only and does not constitute financial advice, investment recommendation, or solicitation to buy or sell any cryptocurrency. Cryptocurrency markets are highly volatile and involve substantial risk of loss. Past performance is not indicative of future results. The technical indicators and levels discussed are based on historical data and may not predict future price movements. Always conduct your own research and consult with a qualified financial advisor before making any investment decisions. The author and Pionex are not responsible for any financial losses incurred.
FAQ
Q: Why is Bitcoin’s RSI at 22.7 considered oversold, and what does that mean?
An RSI below 30 is generally considered oversold, indicating that the asset has been sold off heavily and may be due for a bounce or consolidation. However, oversold conditions can persist in strong downtrends, so it is not a guaranteed buy signal. It suggests that selling pressure may be exhausted in the near term, but confirmation from volume or price action is needed.
Q: Ethereum dropped 26.77% in 30 days—is this a buying opportunity?
The 30-day decline is significant, and the current price is near the 30-day low of $1,506. While some traders may see this as a discount, the low volume and bearish trend suggest caution. DCA strategies can help mitigate risk by averaging in over time rather than buying a single lump sum.
Q: What does low volume (0.36x and 0.23x average) indicate for the market?
Low volume relative to the 7-day average indicates that the current price movements are not backed by strong participation. This makes the rally less reliable and more susceptible to sudden reversals. It suggests that large institutional players may be sitting on the sidelines, and retail activity is subdued.
Q: How reliable are the support and resistance levels mentioned in the table?
Support and resistance levels are based on recent price history (30-day high/low and weekly high/low). They are technical reference points, not guarantees. In low-volume conditions, these levels can be broken more easily. Traders should use them as guidelines and combine with other indicators like volume and RSI.
Q: What strategy is best for a beginner in this market environment?
For beginners, a DCA bot on Pionex is recommended. It automates purchases at regular intervals or price dips, reducing the need to time the market. Avoid leverage or complex strategies until you understand the risks. Grid trading can also be considered if you are comfortable with range-bound markets, but start with small allocations.