BTC ETH Daily Recap – 2026-05-25
BTC ETH Daily Recap – 2026-05-25
Today at a Glance
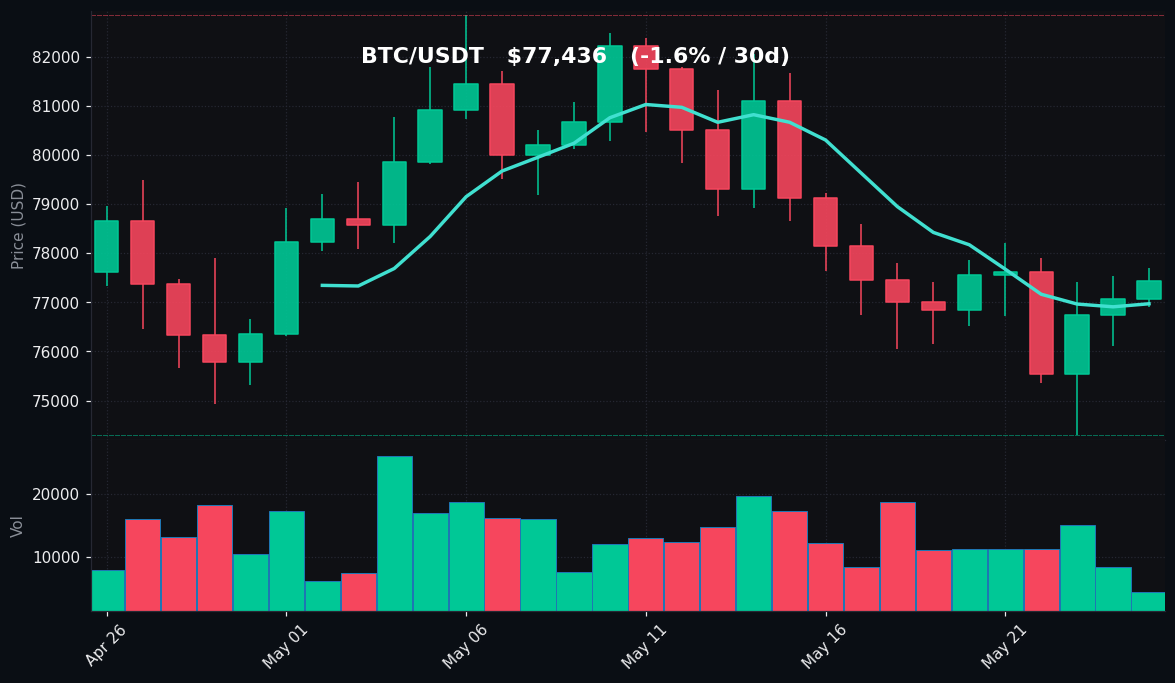
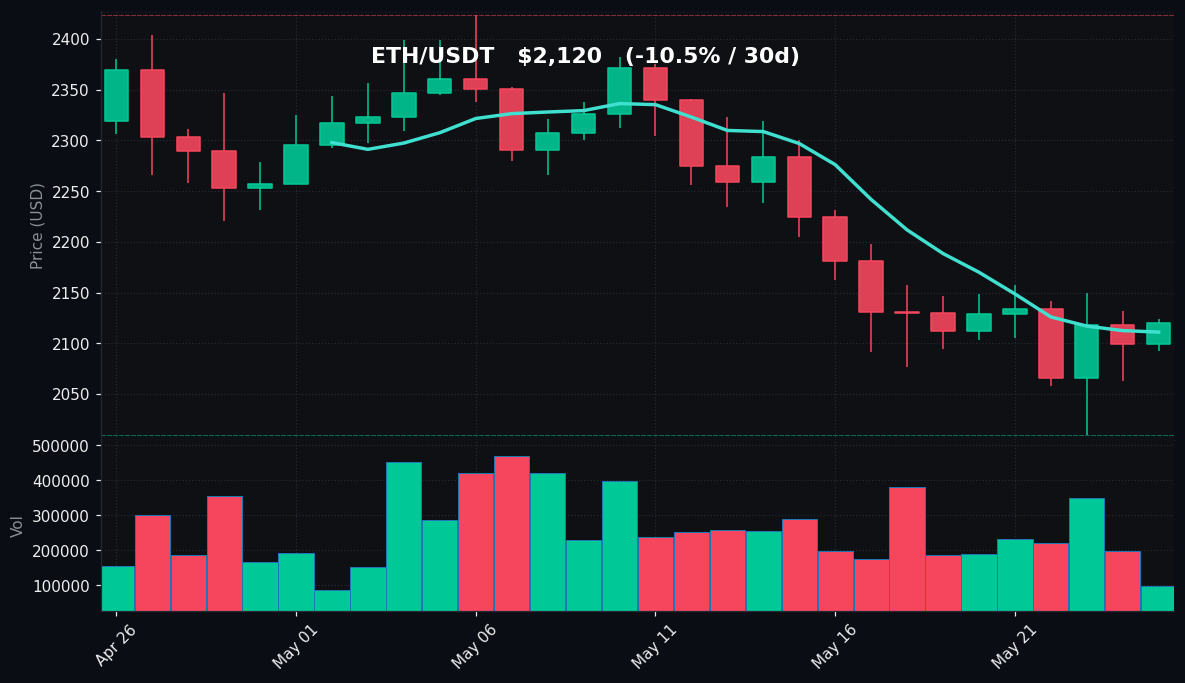
On May 25, 2026, Bitcoin (BTC) and Ethereum (ETH) both saw modest intraday gains after a period of subdued activity. BTC/USDT traded at $77,436, up 0.48% over the past 24 hours, with a daily high of $77,700 and a low of $76,914. Over the past week, BTC managed a slight 0.56% increase, though its 30-day performance remains negative at -1.55%. Ethereum traded at $2,120, gaining 0.95% on the day, with a high of $2,124 and a low of $2,092. However, ETH’s weekly and monthly trends are bearish, down 0.48% and 10.53% respectively. Volume for both assets is significantly below their respective 7-day averages—BTC at 0.36x and ETH at 0.39x—indicating a lack of strong directional conviction. RSI readings on the daily timeframe show BTC at 33.7 (approaching oversold) and ETH at 25.9 (clearly oversold), suggesting potential for mean reversion but also persistent selling pressure. The market remains cautious, with both assets trading below their 30-day moving averages.
Bitcoin Analysis
TradingView Live (4h)
Bitcoin’s price action on May 25 continues to reflect a period of low volatility and declining momentum. The asset is currently trading at $77,436, just above its 7-day moving average of $76,971, but well below the 30-day moving average of $78,615. This “death cross” like configuration—where the short-term MA sits below the longer-term MA—is a classic sign of a bearish trend over the past month. The 30-day high of $82,850 and low of $74,290 highlight a significant 10.3% range, with the recent price hovering near the lower end of that band.
The daily RSI(14) of 33.7 is approaching the oversold threshold of 30, indicating that selling pressure has been dominant but may be exhausting. The last time BTC’s RSI was this low was in early May, after which a brief bounce occurred. Volume today is only 0.36 times the average of the past 7 days, confirming that the move higher from the $76,914 intraday low lacks strong participation. This low-volume recovery could be a sign of short-covering or accumulation, but without volume confirmation, it remains fragile.
Key technical levels to watch: immediate support sits at the recent 30-day low of $74,290, a level that has held twice in the past week. A break below that could open the door to the psychological $70,000 zone. Resistance is first at the 7-day MA of $76,971 (already breached intraday), then the 30-day MA at $78,615, and finally the recent 7-day high of $78,200. The 30-day high of $82,850 remains a distant resistance. The low RSI and proximity to support suggest a potential for a short-term bounce, but the broader trend remains negative as long as price stays below $78,615.
Ethereum Analysis
TradingView Live (4h)
Ethereum’s technical picture is notably weaker than Bitcoin’s. At $2,120, ETH is trading just above its 7-day moving average of $2,111 but far below the 30-day moving average of $2,245. The 30-day performance of -10.53% is significantly worse than BTC’s -1.55%, and the 30-day range of $2,009 to $2,424 shows a 17.1% swing, with the current price closer to the bottom.
The RSI(14) at 25.9 is deeply oversold, a level not seen since March 2026. This extreme reading often precedes a technical bounce, but it also reflects persistent selling pressure. Volume is low at 0.39x the 7-day average, similar to BTC, suggesting that the oversold condition is not yet attracting aggressive buying. The daily high of $2,124 barely exceeded the 7-day MA, showing that sellers remain in control above that level.
Immediate support is the 30-day low of $2,009, a critical level. A break below that would likely test the psychological $2,000 mark and potentially the next support near $1,900. Resistance levels include the 7-day MA at $2,111 (already tested today), the 7-day high of $2,158, and the 30-day MA at $2,245. The 30-day high of $2,424 is a major resistance. The oversold RSI and proximity to support suggest a potential bounce, but the downward trend is more pronounced than BTC’s. ETH’s underperformance relative to BTC may continue unless a catalyst emerges.
Key Technical Levels
| Asset | Support | Resistance | RSI |
|---|---|---|---|
| BTC | $74,290 | $78,615 | Oversold (33.7) |
| ETH | $2,009 | $2,245 | Oversold (25.9) |
BTC vs ETH Dynamic
The correlation between Bitcoin and Ethereum remains high, but the magnitude of moves differs significantly. Over the past 30 days, BTC has declined 1.55% while ETH has dropped 10.53%, indicating a clear underperformance of ETH relative to BTC. This is reflected in the ETH/BTC ratio, which has likely fallen. The 24-hour gains of 0.48% for BTC and 0.95% for ETH show a slight catch-up attempt by ETH, but volume remains low for both. The RSI divergence—BTC at 33.7 (near oversold) and ETH at 25.9 (deeply oversold)—suggests that ETH may be closer to a technical bounce, but the lack of volume and weaker trend make it riskier. In low-volume environments, ETH tends to be more volatile, both to the upside and downside. The current dynamic favors BTC as the relative strength leader, but both assets are in a bearish phase.
Strategy Fit
Given the current market conditions—low volatility, declining volume, and oversold RSI readings on both BTC and ETH—a range-bound or mean-reversion strategy is most appropriate. The low volume (0.36x and 0.39x of 7-day average) indicates that trends are not strong, and sharp directional moves are unlikely without a catalyst.
Grid trading is well-suited here. With BTC trading near support ($74,290) and resistance ($78,615), a grid bot on Pionex can capture small price swings within this range. The 7-day range of $74,290 to $78,200 provides a ~5% bandwidth for profitable grid entries. Similarly, ETH’s range of $2,009 to $2,158 offers a ~7% bandwidth. The oversold RSI suggests a potential bounce, so a grid skewed toward buying near support could be effective.
DCA (Dollar-Cost Averaging) is also viable for long-term holders, especially given the 30-day decline. A DCA bot on Pionex can accumulate positions at lower prices without timing the market. However, the low volume and bearish MA structure suggest that DCA should be done with caution, perhaps with smaller increments.
Trend-following strategies are not recommended as both assets are below their 30-day MAs and RSI is low. A breakout above $78,615 (BTC) or $2,245 (ETH) would be needed to confirm a trend reversal.
Pionex’s built-in grid and DCA bots are ideal for these conditions, as they automate the process and remove emotional decision-making. A neutral grid bot with a range of $74,000 to $79,000 for BTC and $2,000 to $2,200 for ETH would be appropriate.
Risk Disclaimer
This market recap is for informational and educational purposes only. It does not constitute financial advice, investment advice, or a recommendation to buy, sell, or hold any cryptocurrency. Trading cryptocurrencies involves substantial risk, including the potential loss of your entire capital. Past performance is not indicative of future results. Always conduct your own research and consult with a qualified financial advisor before making any investment decisions. The technical levels and strategies mentioned are based on historical data and may not be reliable in all market conditions.
FAQ
Q: Why is Bitcoin’s RSI at 33.7 but still not oversold?
A: The RSI(14) of 33.7 is approaching the oversold threshold of 30 but has not crossed it. This indicates that selling pressure is high but not yet at extreme levels. Oversold conditions (below 30) often precede a bounce, but BTC’s RSI is not yet there, suggesting further downside risk remains.
Q: Ethereum is down 10.53% in 30 days. Is this a buying opportunity?
A: The 30-day decline is significant, and the RSI at 25.9 is deeply oversold, which historically can precede a bounce. However, low volume (0.39x average) and the bearish MA structure (price below MA30) suggest caution. A buying opportunity may emerge if support at $2,009 holds and volume increases.
Q: What does low volume (0.36x for BTC) mean for traders?
A: Low volume indicates reduced market participation and liquidity. This can lead to increased volatility on small orders and false breakouts. Traders should use wider stop-losses and consider lower leverage. Grid or DCA strategies are more suitable than trend-following in low-volume environments.
Q: How do the MA7 and MA30 levels affect trading decisions?
A: When the MA7 is below the MA30 (as seen with both BTC and ETH), it signals a bearish trend. Traders often view the MA30 as resistance and the MA7 as a short-term support/resistance level. A price crossing above the MA30 with volume could signal a trend reversal.
Q: What is the best Pionex bot for this market condition?
A: A grid trading bot is most suitable for the current low-volatility, range-bound market. For BTC, set a range of $74,000 to $79,000 with a neutral grid. For ETH, a range of $2,000 to $2,200 works well. Alternatively, a DCA bot can be used for long-term accumulation, but with smaller position sizes due to the bearish trend.