BTC ETH Daily Recap – May 23, 2026
BTC ETH Daily Recap – May 23, 2026
Today at a Glance
The crypto market continued its downward trajectory on May 23, 2026, with both Bitcoin and Ethereum posting losses amid persistent selling pressure. Bitcoin (BTC) traded at $75,162, down 0.50% in the last 24 hours and 3.82% over the past week, after hitting a fresh 30-day low of $74,290. The asset remains below its key moving averages, with the MA7 at $76,738 and MA30 at $78,581, signaling a bearish short-term structure. Ethereum (ETH) underperformed, falling 1.11% on the day to $2,043 and suffering a steeper 6.32% weekly decline. ETH also recorded a new 30-day low at $2,009, and its RSI(14) dropped to 19.6, entering deeply oversold territory. Trading volumes for both assets remained below their 7-day averages (BTC at 0.71x, ETH at 0.76x), suggesting reduced participation and potential exhaustion of selling pressure. The broader market sentiment remains cautious, with bears firmly in control as both assets test critical support zones.
Bitcoin Analysis
TradingView Live (4h)
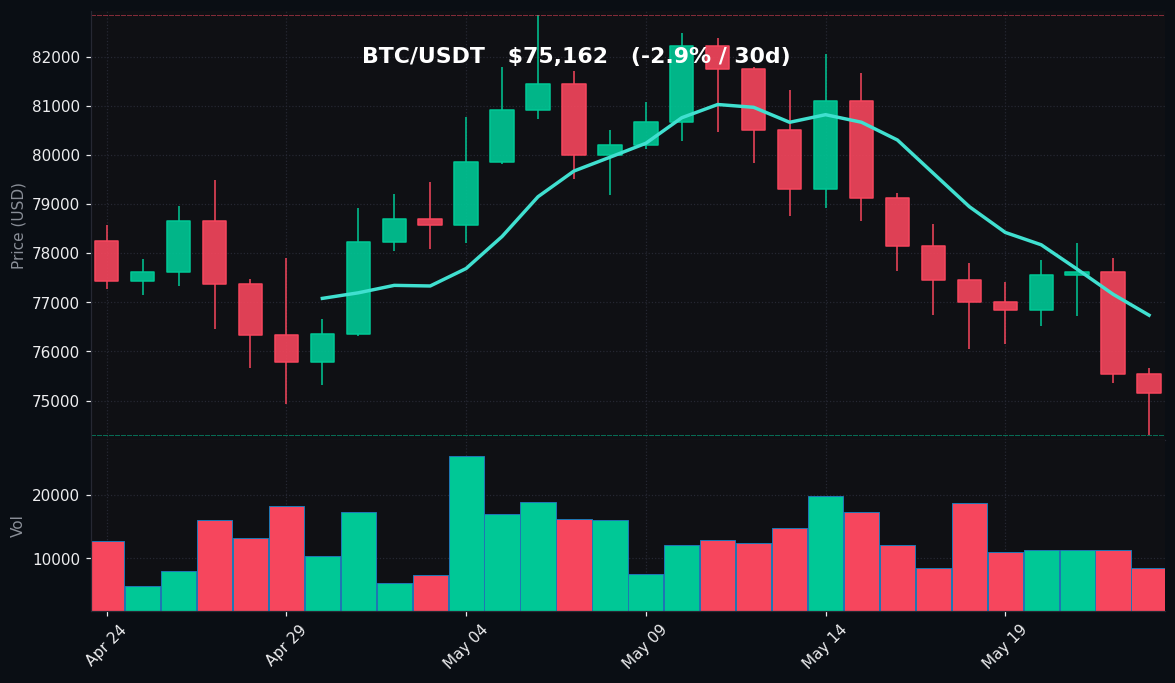
Bitcoin’s price action on May 23 reflects a continuation of the corrective phase that began after the asset failed to sustain levels above $78,000. The daily candle shows a narrow range between $74,290 and $75,665, with the price closing near the session low at $75,162. This represents a 0.50% decline, extending the week’s losses to 3.82%. The 7-day high of $78,600 and 30-day high of $82,850 now appear distant, as the market has consistently rejected higher prices.
Technically, Bitcoin is trading below both its 7-day moving average (MA7: $76,738) and 30-day moving average (MA30: $78,581). This “death cross” configuration — where the short-term average is below the longer-term average — is a classic bearish signal, indicating that recent price momentum is weaker than the broader trend. The MA7 has acted as dynamic resistance since May 20, with each intraday bounce failing to reclaim this level.
The Relative Strength Index (RSI) for Bitcoin stands at 29.9, firmly in oversold territory (below 30). This suggests that selling pressure has been intense and that the asset may be due for a technical bounce or consolidation. However, in strong downtrends, oversold conditions can persist for extended periods, so traders should not automatically interpret this as a reversal signal. The RSI has not been this low since the mid-March correction, when BTC briefly dipped below $72,000 before recovering.
Volume analysis reveals a notable divergence: the 24-hour trading volume is only 0.71 times the 7-day average volume. This declining volume during a price drop can be interpreted in two ways. On one hand, it may indicate that selling pressure is waning, as fewer participants are willing to sell at these levels. On the other hand, it also reflects a lack of buying interest, which could delay any meaningful recovery. The combination of oversold RSI and declining volume often precedes a period of sideways consolidation rather than a sharp reversal.
Key support to watch is the $74,290 level, which represents both the 24-hour low and the 30-day low. A breakdown below this level could open the door to the $72,000–$73,000 zone, where previous demand was observed in March. On the upside, the first resistance is the MA7 at $76,738, followed by the $78,000 psychological level. Without a catalyst or volume increase, reclaiming these levels appears challenging in the near term.
Ethereum Analysis
TradingView Live (4h)
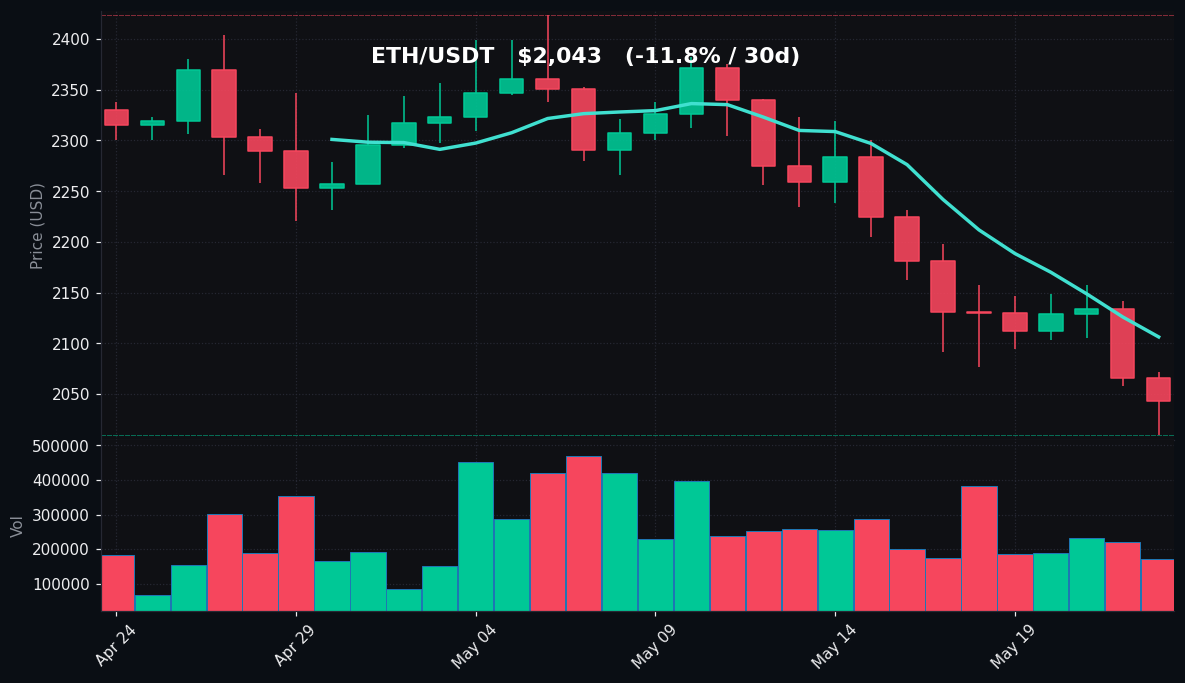
Ethereum’s performance on May 23 was notably weaker than Bitcoin’s, with the asset declining 1.11% to $2,043. The intraday range was $2,009 to $2,072, and ETH is now down 6.32% over the past week and 11.75% over the past 30 days. The 30-day low of $2,009 is dangerously close to the psychological $2,000 support, a level that has historically triggered significant buying interest.
The technical picture for Ethereum is more bearish than Bitcoin’s. ETH is trading well below its MA7 of $2,106 and MA30 of $2,257, with the spread between the current price and the 30-day average widening to approximately 9.5%. This indicates that the downtrend is accelerating rather than stabilizing. The MA7 has provided consistent resistance since May 18, with each attempted rally failing to break above this moving average.
The most striking technical indicator for Ethereum is the RSI(14), which reads 19.6. This is deep in oversold territory (below 30) and represents the lowest RSI reading for ETH in over six months. An RSI below 20 is rare and typically signals extreme selling exhaustion. Historically, such readings have often preceded short-term bounces of 5–10% within 1–3 days, though the sustainability of any rally depends on broader market conditions and volume confirmation.
Volume for ETH is at 0.76 times the 7-day average, similar to Bitcoin’s pattern of declining participation. However, the slightly higher relative volume for ETH compared to BTC (0.76x vs 0.71x) suggests that selling pressure on ETH, while still below average, is relatively more active. This could be due to profit-taking from recent DeFi positions or liquidations in leveraged ETH positions.
The $2,000 level is the immediate and most critical support. A daily close below this level could trigger accelerated selling, with the next major support zone around $1,920–$1,950, where the asset found buying interest in late March. On the upside, resistance is at the MA7 ($2,106), followed by the $2,150 level. The 30-day high of $2,424 seems distant unless a significant catalyst emerges. The extreme oversold RSI suggests that a relief rally is possible, but traders should watch for volume confirmation and a close above $2,050 to signal any short-term stabilization.
Key Technical Levels
| Asset | Support | Resistance | RSI |
|---|---|---|---|
| BTC | $74,290 | $76,738 (MA7) | Oversold (29.9) |
| ETH | $2,009 | $2,106 (MA7) | Oversold (19.6) |
BTC vs ETH Dynamic
The correlation between Bitcoin and Ethereum remains high, with both assets moving in tandem during the current downtrend. However, Ethereum is underperforming Bitcoin in both relative and absolute terms. Over the past 7 days, BTC has declined 3.82% while ETH has fallen 6.32%, resulting in a BTC dominance shift. The ETH/BTC ratio has dropped to approximately 0.0272, near its lowest point in the past month. This divergence is typical in bearish phases, where investors rotate into Bitcoin as a relative safe haven within the crypto space. The underperformance of ETH is also reflected in its RSI (19.6 vs BTC’s 29.9), indicating that selling pressure on Ethereum is more intense and less exhausted. A reversal in this dynamic would require ETH to break above its MA7 and show relative strength against BTC, which has not yet materialized.
Strategy Fit
Given the current market conditions — characterized by oversold RSI readings, declining volume, and prices below key moving averages — the environment is best suited for range-bound and accumulation strategies rather than aggressive trend-following approaches.
Grid Trading: The current volatility is moderate (BTC intraday range ~1.8%, ETH ~3.1%), making grid trading a viable option for capturing small price oscillations within the established support and resistance zones. For BTC, a grid between $74,000 and $77,000 could capture bounces off support. For ETH, a grid between $2,000 and $2,100 would align with the current range. Pionex’s built-in grid trading bots can automate this strategy, allowing users to profit from volatility without active management.
DCA (Dollar-Cost Averaging): The oversold conditions and proximity to key support levels make this an attractive time for DCA strategies. Investors looking to accumulate BTC near $75,000 and ETH near $2,000 can benefit from lower average entry prices. Pionex’s DCA bot can be set to buy fixed amounts daily or weekly, reducing the impact of timing risk.
Trend Following: This strategy is currently not recommended, as both assets are in clear downtrends. Trend-following bots would likely generate losses due to the lack of sustained upward momentum. Waiting for a confirmed breakout above MA7 levels (BTC above $76,738, ETH above $2,106) would be prudent before deploying trend strategies.
Reversal Trading: The extreme RSI readings (especially for ETH at 19.6) suggest that a contrarian reversal trade could be considered, but only with tight stop-losses. This approach carries higher risk and is better suited for experienced traders using Pionex’s futures bots with leverage control.
Risk Disclaimer
This market recap is for informational and educational purposes only and does not constitute financial advice, investment recommendation, or solicitation to buy or sell any digital assets. Cryptocurrency markets are highly volatile and involve substantial risk of loss. Past performance and technical indicators are not guarantees of future results. Always conduct your own research, assess your risk tolerance, and consult with a qualified financial advisor before making any investment decisions. The use of automated trading bots, including those offered by Pionex, does not eliminate the risk of loss. Trading involves risk, and you should never invest more than you are willing to lose.
FAQ
Q: Why is Bitcoin’s RSI at 29.9 considered oversold, and what does that mean for the price?
A: An RSI below 30 is technically considered oversold, indicating that the asset has been sold off heavily and may be undervalued in the short term. Historically, this can precede a bounce or consolidation, but it does not guarantee a reversal. In strong downtrends, RSI can remain oversold for days or weeks.
Q: Ethereum’s RSI is 19.6 — is that an extreme level?
A: Yes, an RSI below 20 is rare and indicates extreme selling pressure. It suggests that sellers are exhausted and a short-term relief rally is statistically more likely. However, traders should wait for confirmation (e.g., a bullish candlestick pattern or volume spike) before acting.
Q: What are the key support levels for BTC and ETH if the current lows break?
A: For BTC, if $74,290 fails, the next support is around $72,000–$73,000, a zone that held in March. For ETH, a break below $2,009 opens the door to $1,920–$1,950. Both levels have historical significance as demand zones.
Q: Why is volume declining while prices are falling?
A: Declining volume during a downtrend can indicate that selling pressure is waning and that the move is losing momentum. However, it also shows a lack of buying interest, which can lead to prolonged sideways movement rather than a sharp reversal.
Q: What trading strategy is best suited for these market conditions?
A: Grid trading and DCA are currently the most appropriate strategies. Grid trading captures small price moves within the range, while DCA allows for accumulation at lower prices. Trend-following strategies should be avoided until prices reclaim their short-term moving averages.