BTC ETH Daily Recap – June 21, 2026
BTC ETH Daily Recap – June 21, 2026
Today at a Glance
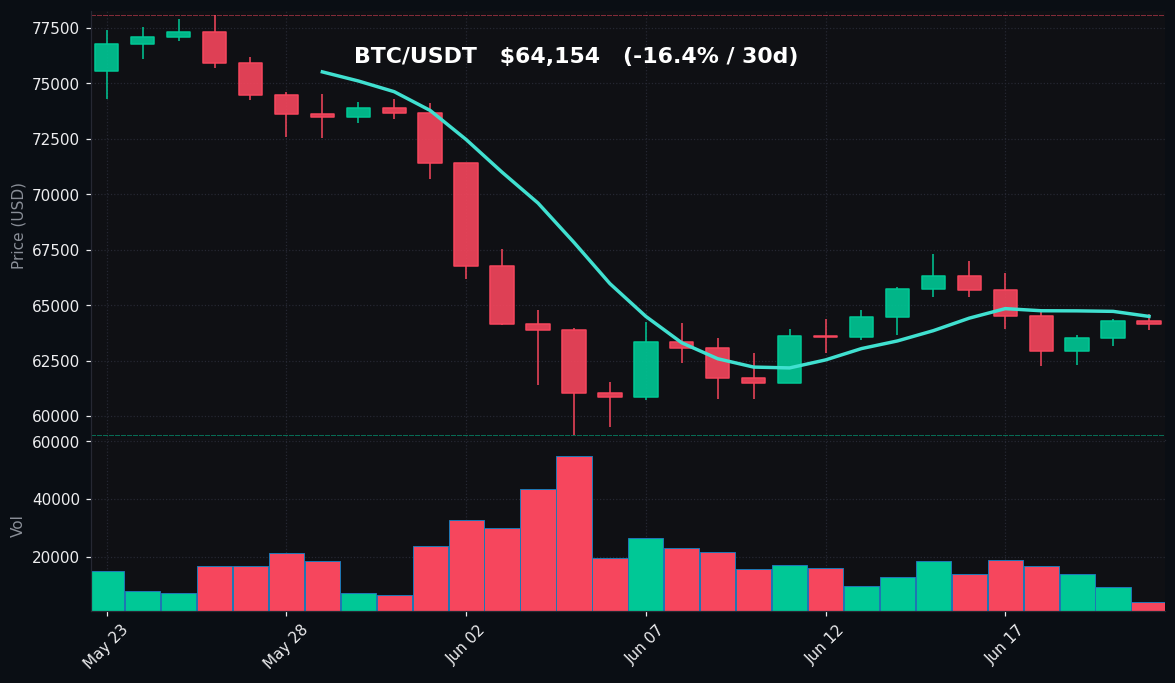
Bitcoin (BTC) and Ethereum (ETH) continued their consolidation phase on June 21, 2026, with both assets trading in relatively tight ranges amid significantly reduced trading volumes. BTC/USDT edged down 0.22% to $64,154, failing to hold above the $64,500 level after hitting a daily high of $64,588. The market saw a 7-day decline of 2.42% for Bitcoin, while Ethereum showed a flat 7-day performance at +0.01% despite a 0.88% daily drop to $1,726. Both assets are trading below their 30-day moving averages, indicating sustained bearish pressure over the past month. BTC has lost 16.41% over 30 days, while ETH has declined 18.50% in the same period. The Relative Strength Index (RSI) for both coins sits in neutral territory (BTC: 53.5, ETH: 54.6), suggesting no immediate overbought or oversold conditions. Volume remains notably low—BTC at 0.29x its 7-day average and ETH at 0.22x—pointing to a lack of conviction among traders and a potential buildup for a decisive move.
Bitcoin Analysis
TradingView Live (4h)
Bitcoin is currently trading at $64,154, positioned below its 7-day moving average of $64,495 and significantly below its 30-day moving average of $67,428. This MA structure confirms a short-term bearish bias, as the price has failed to reclaim the 7-day MA after the 2.42% weekly decline. The 7-day high of $67,292 and low of $62,272 highlight a wide range over the past week, but the current price near the middle of that range suggests indecision.
From a technical perspective, the $63,900 intraday low served as immediate support, while the $64,588 high failed to break above the 7-day MA resistance. The RSI at 53.5 is neutral, not signaling exhaustion or momentum. However, the volume at just 0.29x the 7-day average is a critical red flag—such low participation often precedes either a sharp breakout or a breakdown, as liquidity thins. The 30-day high of $78,080 and low of $59,131 provide the broader context: Bitcoin has retraced over 17% from its monthly peak, and the $59,000–$60,000 zone remains a key support floor from recent months.
Key technical levels to watch include the $63,900 support (today's low) and the $64,500 resistance (7-day MA). A break above the 7-day MA could trigger a move toward $65,500–$66,000, while a loss of $63,900 may open the door to retest the $62,272 weekly low. The lack of volume suggests traders are waiting for a catalyst—either macroeconomic data or a major on-chain event—to determine the next direction.
Ethereum Analysis
TradingView Live (4h)
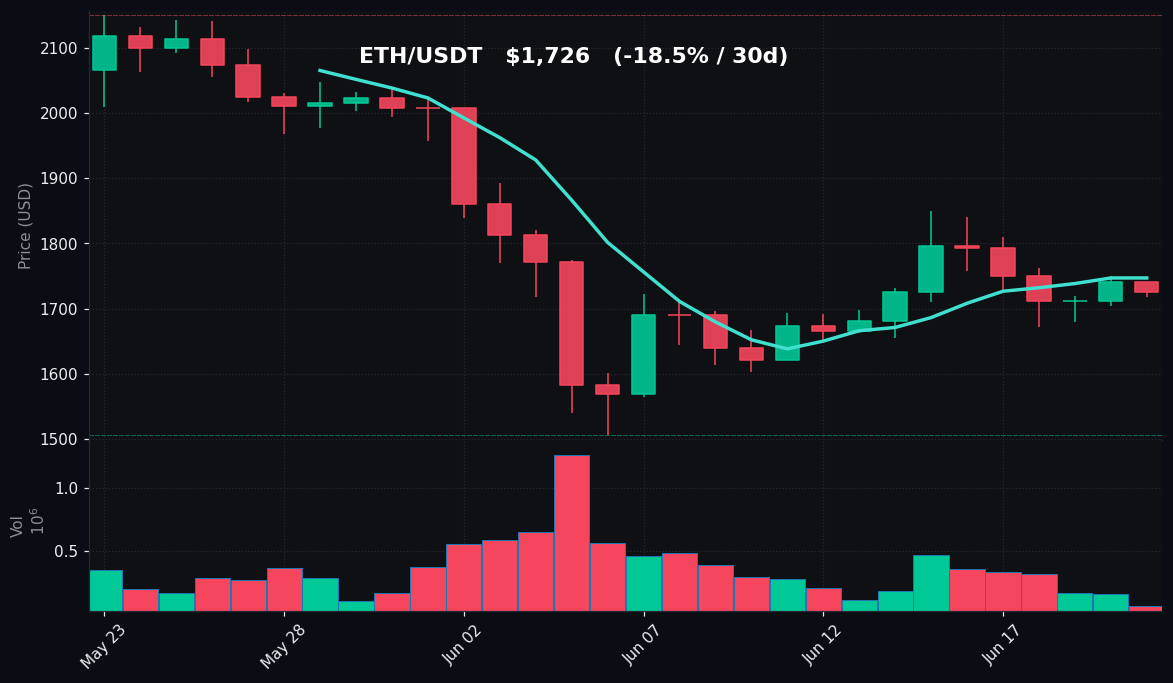
Ethereum is trading at $1,726, down 0.88% on the day, with a 7-day performance essentially flat at +0.01%. This near-zero weekly change masks a volatile week that saw a high of $1,850 and a low of $1,672. The current price sits below the 7-day MA of $1,747 and well below the 30-day MA of $1,823, confirming a bearish medium-term trend. Over the past 30 days, ETH has lost 18.50% of its value, underperforming Bitcoin slightly on a percentage basis.
The RSI at 54.6 is neutral, similar to Bitcoin, but the volume is even more subdued at 0.22x the 7-day average. This extremely low volume suggests that ETH is in a low-volatility consolidation phase, with the daily range of just $24 (high $1,741, low $1,717) being the tightest in recent weeks. The 30-day range of $1,506 to $2,150 shows the massive volatility that has since subsided.
Technically, ETH faces resistance at the 7-day MA of $1,747 and stronger resistance at $1,823 (30-day MA). Support sits at today's low of $1,717 and the weekly low of $1,672. A break below $1,672 could accelerate selling toward the $1,500–$1,600 zone, while a move above $1,747 would be the first sign of bullish momentum. The flat weekly performance suggests ETH is forming a potential base, but the low volume indicates that accumulation has not yet begun in earnest.
Key Technical Levels
| Asset | Support | Resistance | RSI |
|---|---|---|---|
| BTC | $63,900 | $64,495 (MA7) | 53.5 – neutral |
| ETH | $1,717 | $1,747 (MA7) | 54.6 – neutral |
BTC vs ETH Dynamic
The correlation between Bitcoin and Ethereum remains high, as both assets are trading in neutral RSI territory with extremely low volumes. Bitcoin's 7-day decline of 2.42% contrasts with Ethereum's flat performance, suggesting a slight rotation into ETH on a relative basis. However, the 30-day performance tells a different story: both are down roughly 16–18%, indicating that the broader market trend is bearish. The ETH/BTC ratio has stabilized near 0.0269, down from 0.0275 a week ago, reflecting Bitcoin's relative strength over the month. The lack of divergence in technical setups—both below their 30-day MAs, both with neutral RSI, both with low volume—suggests that any major move in Bitcoin will likely be mirrored by Ethereum. Traders should watch for a break of the $63,900 support on BTC, which could trigger a corresponding breakdown in ETH below $1,717.
Strategy Fit
Given the current low-volatility, low-volume environment, directional trend-following strategies are not optimal. The neutral RSI and tight ranges favor mean-reversion or range-bound approaches. A grid trading bot is particularly well-suited here, as it can profit from the small intraday oscillations between support and resistance. For BTC, a grid between $63,900 and $64,500 could capture the current range. For ETH, a grid between $1,717 and $1,747 aligns with today's levels. Pionex’s built-in grid trading bot allows users to set these parameters automatically and earn from volatility without predicting direction.
Alternatively, DCA (Dollar-Cost Averaging) into both assets is reasonable given the 30-day decline of 16–18%, as the current prices are closer to the lower end of the monthly range. However, the low volume suggests that a bottom may not yet be confirmed, so DCA should be done with caution. Trend-following strategies (e.g., trailing stop or momentum bots) are not recommended until volume picks up and a clear breakout above the 7-day MA occurs. Pionex’s infinity grid or leveraged grid bots could also be considered for advanced users, but the neutral RSI suggests limited immediate upside.
Risk Disclaimer
This market recap is for informational and educational purposes only and does not constitute financial advice, investment recommendation, or solicitation to trade. Cryptocurrency markets are highly volatile and involve substantial risk of loss. Past performance is not indicative of future results. Always conduct your own research (DYOR) and consult with a qualified financial advisor before making any trading or investment decisions. The technical levels and strategies discussed are based on historical data and may not predict future market movements. Trading with leverage or bots can amplify both gains and losses.
FAQ
Q: Why is Bitcoin volume so low today (0.29x average)?
A: Low volume often occurs during weekends or periods of market indecision. The 0.29x ratio indicates that today's trading activity is about 71% below the 7-day average, suggesting traders are waiting for a catalyst such as macroeconomic data or a major news event.
Q: What does a neutral RSI of 53.5 mean for BTC?
A: An RSI of 53.5 is in neutral territory (typically 30–70), meaning the asset is neither overbought nor oversold. This indicates no strong momentum in either direction and suggests the market is consolidating.
Q: Is Ethereum underperforming Bitcoin?
A: Over the past 30 days, ETH is down 18.50% vs BTC's 16.41%, showing slight underperformance. However, on a 7-day basis, ETH is flat (+0.01%) while BTC is down 2.42%, so ETH has held up better recently. The ETH/BTC ratio is near 0.0269, down from monthly highs.
Q: What is the best strategy for this low-volatility market?
A: Grid trading is ideal for range-bound markets with low volatility, as it profits from small price oscillations. DCA is also suitable for long-term accumulation at lower prices. Trend-following strategies are not recommended until volume picks up.
Q: What are the key levels to watch for a breakout?
A: For BTC, a break above $64,500 (MA7) could target $65,500–$66,000, while a break below $63,900 could lead to $62,272. For ETH, a move above $1,747 targets $1,823 (MA30), while a break below $1,717 could test $1,672. Volume confirmation is essential for any breakout.