BTC ETH Daily Recap – June 23, 2026
BTC ETH Daily Recap – June 23, 2026
Today at a Glance
On June 23, 2026, both Bitcoin and Ethereum experienced notable declines, extending their bearish trajectories from the past week and month. Bitcoin (BTC/USDT) closed at $62,509, down 2.36% in the last 24 hours, after touching a daily high of $64,275 and a low of $61,938. The asset is now 4.82% lower over the past seven days and 19.16% lower over the past 30 days. Ethereum (ETH/USDT) saw a sharper 24-hour decline of 3.72%, settling at $1,664, with a daily range of $1,636 to $1,736. ETH’s weekly and monthly drops stand at 7.20% and 21.25%, respectively. Both assets are trading below their 7-day and 30-day moving averages, signaling persistent bearish pressure. Volume for BTC remains near average (1.03x of 7-day average), while ETH’s volume is notably lower (0.69x), suggesting reduced participation. RSI(14) for both is around 53, indicating neutral territory with no immediate overbought or oversold extremes.
Bitcoin Analysis
TradingView Live (4h)
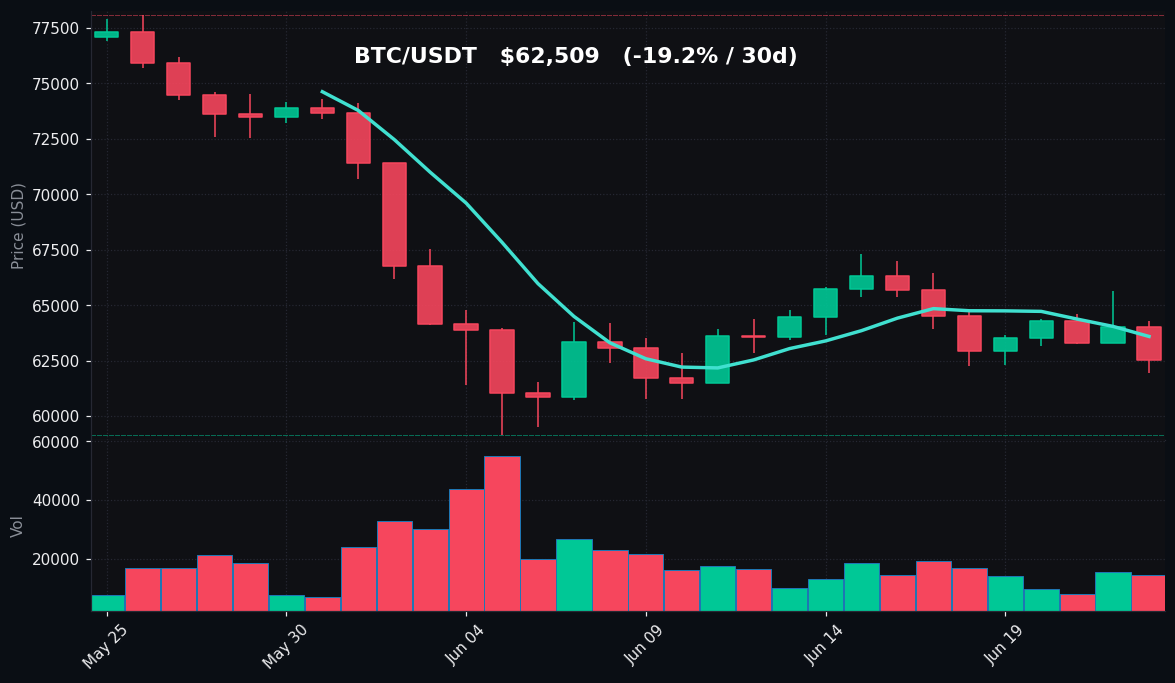
Bitcoin’s price action on June 23 reflects a continuation of the broader downtrend observed over the past month. The asset opened near $64,000 and faced resistance at $64,275 before declining to a low of $61,938, ultimately closing at $62,509. This represents a 2.36% drop in 24 hours, and the price remains well below the 30-day moving average of $66,490, as well as the 7-day moving average of $63,593. The gap between the current price and both MAs highlights sustained selling pressure.
The 30-day range for Bitcoin spans from a low of $59,131 to a high of $78,080, indicating significant volatility over the past month. The current price of $62,509 is near the lower end of this range, suggesting that bears have been in control since the peak at $78,080. The 7-day high of $66,446 and low of $61,938 further confirm that recent price action has been consolidating near the lower boundary of the monthly range.
Volume for BTC is slightly above its 7-day average at 1.03x, indicating that the current decline is accompanied by near-normal trading activity. This suggests that the move is not a low-volume anomaly but rather a reflection of genuine selling interest. The RSI(14) reading of 53.0 places the asset in neutral territory, neither oversold nor overbought. This implies that there is no immediate technical signal for a reversal based on momentum alone, and the market may continue to drift lower or consolidate.
Key technical levels to watch include the immediate support at $61,938 (today’s low) and the psychological $60,000 mark. On the upside, resistance is seen at $63,593 (MA7) and $64,275 (today’s high). A break below $61,938 could open the door toward the 30-day low of $59,131. Conversely, a move above $64,275 would need to overcome the MA7 to signal a short-term recovery. The overall trend remains bearish, with no clear reversal pattern emerging from today’s data.
Ethereum Analysis
TradingView Live (4h)
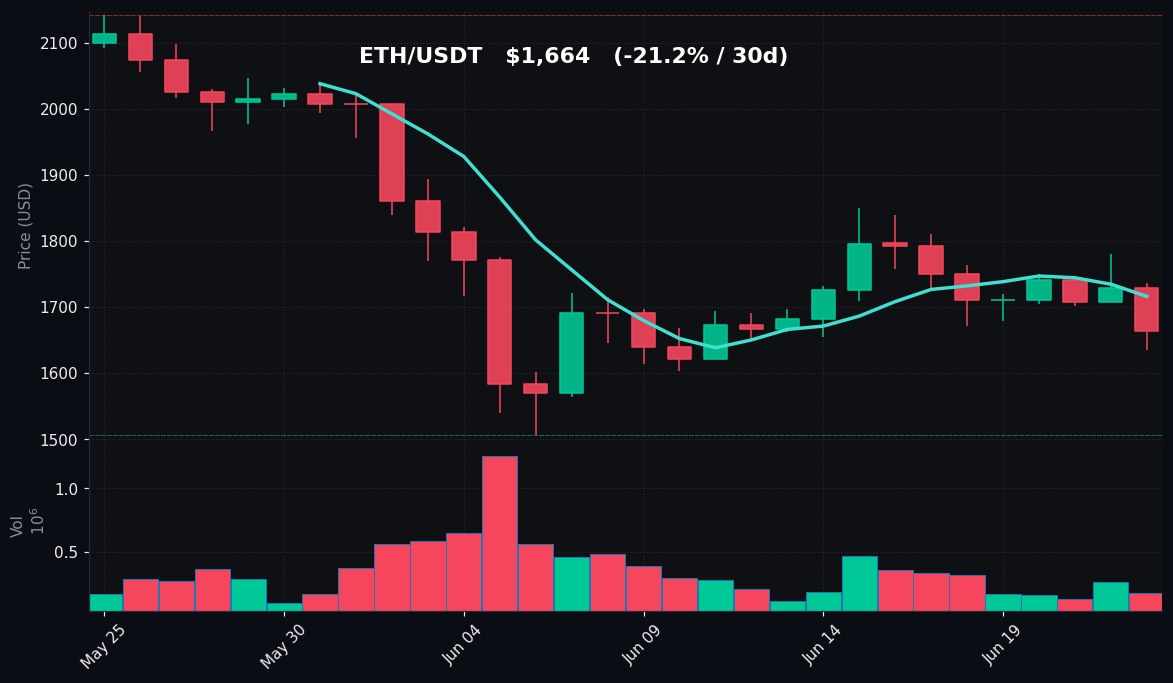
Ethereum’s performance on June 23 was weaker than Bitcoin’s, with a 24-hour decline of 3.72% bringing the price to $1,664. The daily range of $1,636 to $1,736 shows that ETH attempted to rally toward the $1,700 level but failed, closing near the lower end of the range. The asset is now trading below both its 7-day moving average of $1,716 and its 30-day moving average of $1,795, reinforcing the bearish structure seen over the past week and month.
The 30-day range for Ethereum extends from a low of $1,506 to a high of $2,142, with the current price of $1,664 sitting near the lower half of this range. The 7-day high of $1,810 and low of $1,636 indicate that ETH has been under consistent pressure, with each attempt to rally being met with selling. The 7-day decline of 7.20% and 30-day decline of 21.25% highlight the severity of the recent drawdown.
Volume for ETH is notably low, at only 0.69x of its 7-day average. This suggests that the decline is occurring on relatively thin participation, which could indicate a lack of conviction from sellers or a lack of buying interest. Low volume during a downtrend can sometimes precede a sharp move if volume picks up, but for now, it points to a market that is not fully engaged. The RSI(14) reading of 52.8 is similar to Bitcoin’s, placing ETH in neutral territory. This means that momentum is not extreme in either direction, and the price could continue to drift or consolidate.
Immediate support for ETH is at the day’s low of $1,636, followed by the 30-day low of $1,506. Resistance levels include $1,716 (MA7) and $1,736 (today’s high). A break below $1,636 would test the $1,600 psychological level and potentially the monthly low. On the upside, reclaiming $1,716 would be a first step toward reversing the short-term trend. However, the persistent bearish structure and low volume suggest that Ethereum may remain under pressure in the near term.
Key Technical Levels
| Asset | Support | Resistance | RSI |
|---|---|---|---|
| BTC | $61,938 / $60,000 | $63,593 / $64,275 | 53.0 – neutral |
| ETH | $1,636 / $1,506 | $1,716 / $1,736 | 52.8 – neutral |
BTC vs ETH Dynamic
The correlation between Bitcoin and Ethereum remains high, with both assets declining in tandem on June 23. However, Ethereum underperformed Bitcoin, losing 3.72% compared to Bitcoin’s 2.36% drop. Over the past 30 days, Ethereum has also fallen more sharply (-21.25%) than Bitcoin (-19.16%), reflecting its higher beta and greater sensitivity to bearish market sentiment. The volume divergence is notable: Bitcoin’s volume is near average, while Ethereum’s is significantly lower, suggesting that institutional or larger players may be more active in Bitcoin, while retail or smaller participants are less engaged in Ethereum. This dynamic could lead to Ethereum being more prone to sharp moves if volume picks up, but for now, the relative weakness in ETH compared to BTC is a sign of risk-off positioning in the market.
Strategy Fit
Given the current market conditions—bearish trends, neutral RSI, and below-average volume for ETH—a conservative approach is warranted. For traders looking to navigate this environment, grid trading strategies can be effective, particularly for Bitcoin, which has a slightly higher volume and clearer support/resistance levels. A grid bot, such as those available on Pionex, can capture profits from range-bound movements between $61,938 and $63,593. For Ethereum, a DCA (dollar-cost averaging) strategy may be more appropriate, given the low volume and potential for further downside. DCA allows for gradual accumulation at lower prices without the need to time the bottom. Trend-following strategies are less suitable today, as the neutral RSI and lack of clear momentum make it difficult to establish a directional bias. Pionex’s built-in trading bots, including grid and DCA bots, can automate these strategies efficiently, allowing users to benefit from volatility without constant monitoring.
Risk Disclaimer
This market recap is for informational and educational purposes only and does not constitute financial advice, investment recommendation, or solicitation to buy or sell any asset. Cryptocurrency markets are highly volatile and carry significant risk. Past performance is not indicative of future results. Always conduct your own research and consult with a qualified financial advisor before making any investment decisions.
FAQ
What caused the decline in BTC and ETH on June 23?
The declines are part of a broader bearish trend over the past month, with both assets trading below their key moving averages. No single catalyst is evident from the data, but selling pressure and lack of buying interest are contributing factors.
Is Bitcoin oversold based on RSI?
No. Bitcoin’s RSI(14) is 53.0, which is neutral territory. It is not oversold (typically below 30) or overbought (above 70), indicating no extreme momentum.
Why is Ethereum’s volume lower than Bitcoin’s?
Ethereum’s volume is at 0.69x of its 7-day average, while Bitcoin’s is near average. This suggests lower market participation for ETH, which could be due to reduced retail interest or a shift in focus to Bitcoin during uncertain times.
What are the key support levels for BTC and ETH?
For BTC, immediate support is at $61,938 (today’s low) and $60,000 (psychological level). For ETH, support is at $1,636 (today’s low) and $1,506 (30-day low).
What trading strategy is best for current conditions?
Grid trading for Bitcoin and DCA for Ethereum are suitable, given the neutral RSI and bearish trends. These strategies can help manage risk and capture potential profits from range-bound movements or gradual accumulation.