BTC ETH Daily Recap | June 9, 2026: Oversold Extremes and Critical Support Testing
BTC ETH Daily Recap | June 9, 2026: Oversold Extremes and Critical Support Testing
Today at a Glance
The cryptocurrency market experienced another day of pronounced selling pressure on June 9, 2026, with both Bitcoin and Ethereum extending their weekly and monthly declines. Bitcoin (BTC) traded at $62,318, down 1.22% in the last 24 hours, after touching a daily low of $62,140 against a high of $63,526. The leading digital asset has now lost 6.65% over the past week and a staggering 23.77% over the last 30 days, with its 30-day high of $82,380 now a distant memory. Ethereum (ETH) mirrored the weakness, trading at $1,669, a 1.29% daily decline, with a 24-hour range of $1,655 to $1,697. ETH’s weekly performance is notably worse at -10.28%, and its 30-day drawdown of 28.68% underscores the severity of the current correction. Critically, both assets are now trading well below their 7-day and 30-day moving averages, with RSI readings plunging into deeply oversold territory — BTC at 14.8 and ETH at 19.9 — signaling extreme bearish momentum and potential exhaustion of selling pressure. Volume activity has collapsed relative to the 7-day average, with BTC at 0.36x and ETH at 0.31x, suggesting a lack of conviction among sellers but also an absence of strong buying interest.
Bitcoin Analysis
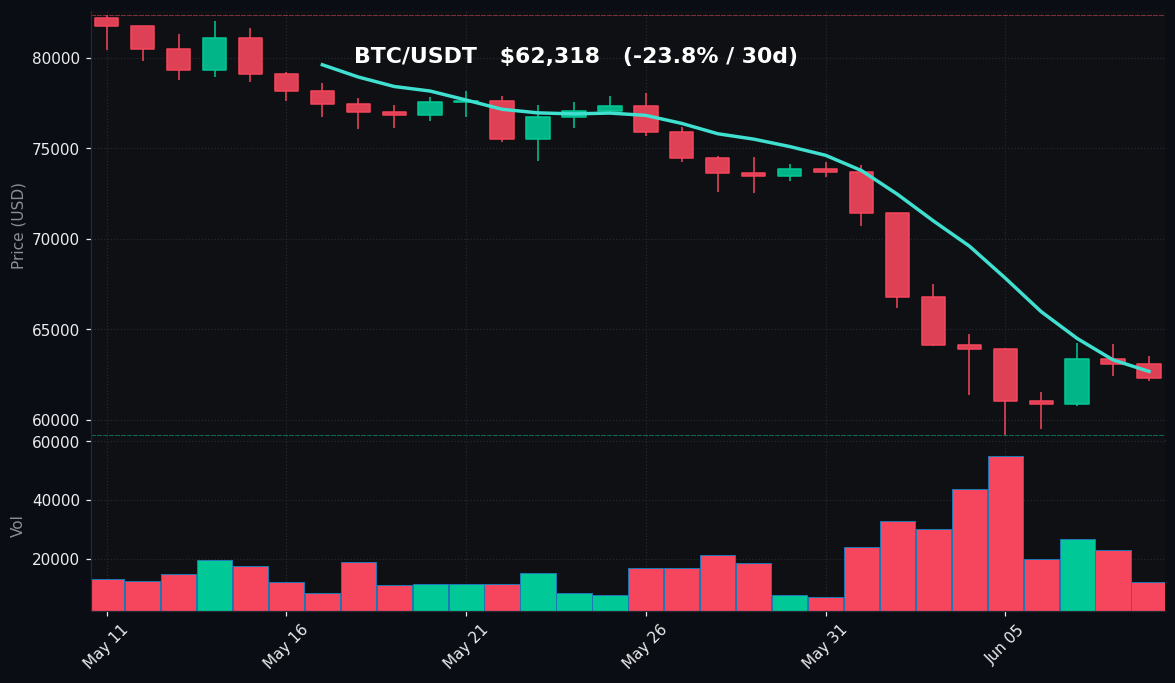
TradingView Live (4h)
Bitcoin’s price action on June 9 continues to reflect a market under sustained duress, with the asset unable to reclaim any meaningful ground above the $63,000 level. The daily high of $63,526 was rejected, and the subsequent slide to $62,140 confirms that sellers remain firmly in control. The 24-hour decline of 1.22% may appear modest, but it occurs within a broader context of a 7-day loss of 6.65% and a 30-day collapse of 23.77%. The 30-day high of $82,380, recorded just one month ago, now seems like a peak from a different market regime.
From a technical perspective, Bitcoin is trading below both its 7-day moving average (MA7) of $62,672 and its 30-day moving average (MA30) of $73,165. The MA7 is acting as immediate resistance, with the price hovering just $354 below it. The MA30, which is $10,847 above the current price, highlights the velocity of the recent decline and the extent to which the asset has deviated from its medium-term trend. The 7-day low of $59,131, tested earlier in the week, remains a critical support level. A break below this would open the door to further downside, potentially toward the $55,000 psychological level.
The Relative Strength Index (RSI) reading of 14.8 is extraordinarily low, indicating that Bitcoin is in deeply oversold territory. An RSI below 30 typically suggests that an asset is oversold, and a reading below 15 is rare, often preceding a technical bounce or at least a period of consolidation. However, in a bearish trend, oversold conditions can persist as prices continue to fall. The volume comparison to the 7-day average at 0.36x is telling: it is significantly below average, indicating that the current move is not accompanied by panic selling or aggressive accumulation. This low volume suggests a market that is drifting lower on reduced participation, possibly due to a lack of catalysts or general market apathy.
Key support levels to watch include the $62,140 daily low, the $59,131 7-day low, and the psychological $60,000 round number. On the upside, resistance is first at the MA7 of $62,672, then the $63,526 daily high, followed by the $67,516 7-day high. The $70,000 level, which was support during the previous uptrend, now serves as a significant resistance zone. The current environment is one of bearish momentum with oversold technicals, but without a clear catalyst for reversal, the path of least resistance remains downward.
Ethereum Analysis
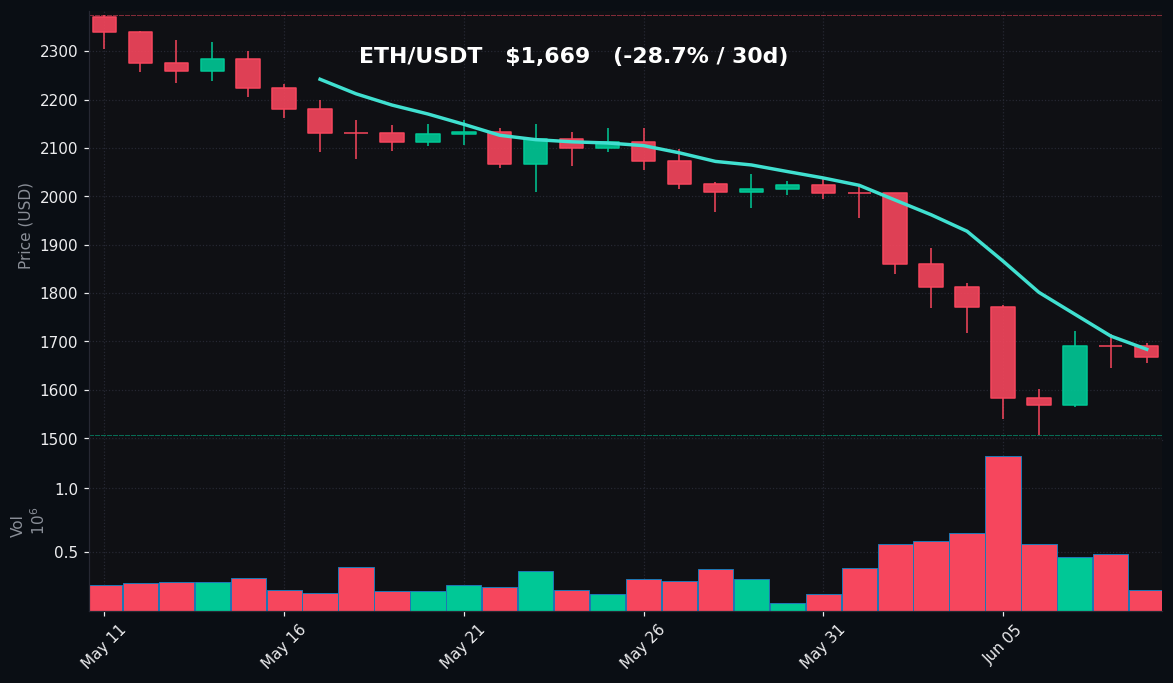
TradingView Live (4h)
Ethereum’s price action on June 9 is even more concerning than Bitcoin’s, with the asset declining 1.29% in the last 24 hours to $1,669, after touching a daily low of $1,655 and a high of $1,697. The 7-day performance of -10.28% is significantly worse than Bitcoin’s, and the 30-day drawdown of 28.68% is also more severe, highlighting Ethereum’s relative underperformance during this correction. The 30-day high of $2,375, reached on May 10, now represents a 29.7% decline to the current price.
From a technical standpoint, Ethereum is trading below both its 7-day moving average (MA7) of $1,684 and its 30-day moving average (MA30) of $2,013. The MA7 is acting as immediate resistance, with the price $15 below it, while the MA30 is a staggering $344 above the current price. This deviation from the medium-term trend is even more pronounced than Bitcoin’s, indicating that Ethereum has experienced a sharper and faster decline. The 7-day low of $1,506, tested on June 6, remains a critical support level. A break below this would likely target the $1,400 level, which has not been seen since late 2023.
The Relative Strength Index (RSI) reading of 19.9 is deeply oversold, though slightly less extreme than Bitcoin’s. An RSI below 20 is a rare occurrence and historically has been associated with significant bottoms or at least sharp bounces. However, like Bitcoin, the volume comparison to the 7-day average at 0.31x is very low, indicating that the current move is occurring on thin participation. This suggests that the selling pressure is not intense, but buying interest is equally absent.
Key support levels for Ethereum are $1,655 (daily low), $1,506 (7-day low), and the psychological $1,500 round number. On the upside, resistance is at the MA7 of $1,684, then the $1,697 daily high, followed by the $1,893 7-day high. The $2,000 level, which was a key psychological and technical level, now serves as a major resistance zone. Ethereum’s underperformance relative to Bitcoin is a notable feature of the current market, often a sign of risk-off sentiment as investors favor the more established asset.
Key Technical Levels
| Asset | Support | Resistance | RSI |
|---|---|---|---|
| BTC | $59,131 (7d low), $62,140 (daily low) | $62,672 (MA7), $63,526 (daily high) | 14.8 (Deeply Oversold) |
| ETH | $1,506 (7d low), $1,655 (daily low) | $1,684 (MA7), $1,697 (daily high) | 19.9 (Oversold) |
BTC vs ETH Dynamic
The correlation between Bitcoin and Ethereum remains strongly positive in the current environment, with both assets declining in lockstep. However, the magnitude of the decline reveals a clear divergence in relative strength. Over the past 7 days, Ethereum has underperformed Bitcoin by approximately 3.6 percentage points (-10.28% vs. -6.65%), and over the past 30 days, the underperformance is nearly 5 percentage points (-28.68% vs. -23.77%). This pattern is consistent with a risk-off phase where capital flows toward Bitcoin as the perceived safer store of value within the crypto ecosystem. The ETH/BTC ratio has been declining, which is a bearish signal for altcoin markets. The current RSI readings, with BTC at 14.8 and ETH at 19.9, suggest that both are oversold, but Bitcoin’s more extreme reading may indicate that it is closer to a potential reversal. However, the low volume on both assets suggests that any reversal will require a catalyst or a significant increase in participation.
Strategy Fit
Given the current market conditions characterized by deeply oversold RSI readings, low volume, and persistent bearish momentum, the most suitable trading strategies are those that capitalize on mean reversion and volatility compression rather than trend following. The extreme oversold readings on both BTC and ETH suggest that the probability of a short-term bounce is elevated, but the low volume indicates that such a bounce may lack follow-through.
For traders with a higher risk tolerance, a grid trading bot could be effective in the current range-bound environment. With BTC oscillating between $62,140 and $63,526, a narrow grid can capture small price movements on both sides. Pionex’s Infinity Grid Bot is particularly well-suited for this, as it allows for continuous trading without a predefined upper or lower price limit, which is useful when support and resistance levels are being tested. For Ethereum, with its range between $1,655 and $1,697, a similar narrow grid can be deployed.
For longer-term investors, a Dollar-Cost Averaging (DCA) bot is highly appropriate at these levels. The 30-day drawdown of 23.77% on BTC and 28.68% on ETH means that investors are accumulating at significantly lower prices than one month ago. Pionex’s DCA bot allows for automated, disciplined accumulation, reducing the emotional impact of further declines. The current oversold conditions make this an attractive entry point for those with a long-term horizon, though further downside cannot be ruled out.
A trend-following strategy is not recommended in the current environment, as the trend is clearly bearish and the RSI is at extreme levels that often precede reversals. Chasing the trend at these levels carries significant risk of buying into a potential bounce that could reverse quickly. Instead, a reversal or mean reversion strategy using limit orders at key support levels could be considered, but this requires precise timing and risk management.
Risk Disclaimer
This market recap is for informational and educational purposes only and does not constitute financial advice, investment advice, or a recommendation to buy, sell, or hold any digital asset. Cryptocurrency markets are highly volatile and involve substantial risk, including the potential loss of principal. Past performance is not indicative of future results. The technical levels and strategies discussed are based on current data and may change rapidly. Always conduct your own independent research and consult with a qualified financial advisor before making any investment decisions. The author and platform are not responsible for any financial losses incurred as a result of acting on the information provided herein.
FAQ
Q: Why is Bitcoin’s RSI so low at 14.8, and what does it mean?
A: An RSI of 14.8 indicates that Bitcoin is in deeply oversold territory, meaning it has experienced a rapid and significant price decline over the past 14 days. Historically, such low readings often precede a short-term bounce or at least a period of consolidation, as selling pressure may be exhausted. However, in a strong bear trend, oversold conditions can persist, so it is not a guaranteed buy signal.
Q: Is the low volume on BTC and ETH a bullish or bearish sign?
A: The current volume at 0.36x (BTC) and 0.31x (ETH) of the 7-day average is a neutral-to-bearish sign. It suggests that the selling pressure is not intense, which could allow for a stabilization. However, it also indicates a lack of strong buying interest, meaning that any upward move may lack conviction. Low volume often precedes a period of range-bound trading or a continuation of the trend on lower participation.
Q: What are the key support levels to watch for Bitcoin and Ethereum?
A: For Bitcoin, the immediate support is the daily low of $62,140, followed by the 7-day low of $59,131. A break below $59,131 could open the door to $55,000. For Ethereum, support is at the daily low of $1,655 and the 7-day low of $1,506. A break below $1,506 could target $1,400. These levels are critical for determining the next directional move.
Q: How does Ethereum’s underperformance relative to Bitcoin affect trading strategies?
A: Ethereum’s underperformance suggests a risk-off environment where capital is flowing toward Bitcoin as a relative safe haven. This makes Ethereum more volatile and potentially more rewarding for short-term mean reversion trades, but also riskier. For grid trading, a wider range may be needed for ETH to account for its higher volatility. For DCA, ETH’s larger drawdown may offer a better long-term entry point, but with higher downside risk.
Q: What is the best trading bot strategy for the current market conditions?
A: Based on the deeply oversold RSI and low volume, a grid trading bot (e.g., Pionex Infinity Grid) for short-term range trading or a DCA bot for long-term accumulation are the most suitable. A trend-following bot is not recommended due to the extreme oversold conditions. A reversal strategy using limit orders at key support levels could also be considered, but requires careful risk management.