BTC ETH Daily Recap – June 7, 2026: Deep Oversold Bounce Amidst Prolonged Bearish Momentum
BTC ETH Daily Recap – June 7, 2026: Deep Oversold Bounce Amidst Prolonged Bearish Momentum
Today at a Glance
June 7, 2026, marks a tentative recovery session for the crypto market after a brutal weekly selloff. Bitcoin (BTC) is trading at $61,777, up 1.47% in the last 24 hours, recovering from an intraday low of $60,746 but still far below the weekly high of $74,092. Ethereum (ETH) shows a stronger 24-hour rebound of 3.15%, currently at $1,619, after touching a low of $1,564. However, the broader picture remains deeply bearish: BTC is down 16.15% over the past week and 23.43% over 30 days, while ETH has lost 19.32% in the week and 30.40% over the month. Both assets are trading well below their key moving averages—BTC below the 7-day MA ($64,274) and 30-day MA ($74,363), and ETH below its 7-day MA ($1,746) and 30-day MA ($2,056). The Relative Strength Index (RSI) for both assets has entered extreme oversold territory: BTC RSI at 8.5 and ETH RSI at 11.9, suggesting that selling pressure is exhausted in the short term but also reflecting a market in distress. Volume for both assets is notably below their 7-day averages (BTC 0.52x, ETH 0.44x), indicating that the bounce is occurring on relatively low participation, which raises questions about its sustainability.
Bitcoin Analysis
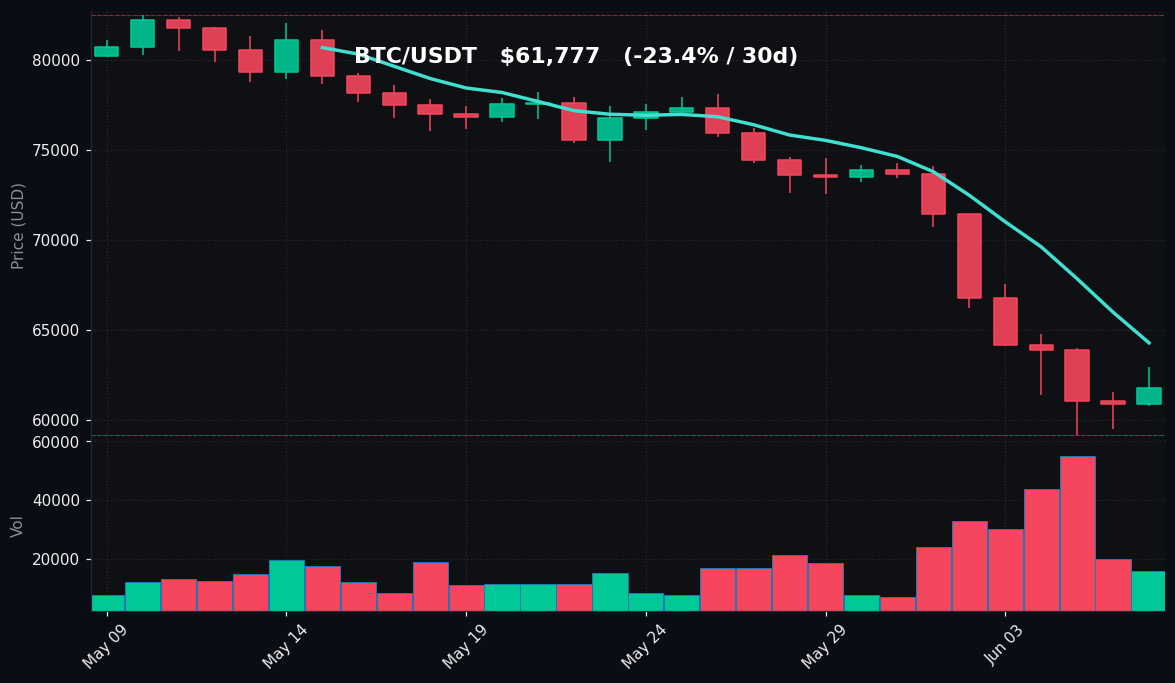
TradingView Live (4h)
Bitcoin's price action on June 7, 2026, presents a classic oversold bounce scenario within a broader downtrend. The asset opened the week near $74,000 but suffered a relentless decline, hitting a 7-day low of $59,131 and a 30-day low at the same level. The current price of $61,777 represents a modest recovery from that low, but it remains 16.6% below the 7-day moving average of $64,274 and a staggering 17.0% below the 30-day moving average of $74,363. The gap between price and the 30-day MA highlights the velocity of the recent selloff, which has been one of the sharpest corrections of the year.
The most striking technical indicator is the RSI(14) reading of 8.5, which is in extreme oversold territory—well below the conventional oversold threshold of 30. Such readings are rare and historically have preceded short-term bounces, but they also indicate that the trend is overwhelmingly bearish. The last time BTC's RSI was this low was during the March 2020 COVID crash, when it briefly dipped below 10 before a sharp recovery. However, the context is different: volume today is only 0.52x the 7-day average, suggesting that the bounce lacks conviction. Low volume bounces in a downtrend are often short-lived and can be followed by further selling.
Key support levels to watch are the recent low at $59,131, which has held as a temporary floor. Below that, the psychological $58,000 zone and the $55,000 area (a prior support from early 2025) become critical. On the upside, immediate resistance is at the 7-day MA of $64,274, followed by the $67,000 level and then the 30-day MA at $74,363. The price action is forming a potential descending triangle pattern, with lower highs since the $82,479 peak 30 days ago and a flat support around $59,000. A break below $59,131 would likely accelerate selling, while a sustained move above $64,274 would signal a short-term trend reversal. The current environment is one of extreme fear, and traders should watch for volume confirmation on any breakout.
Ethereum Analysis
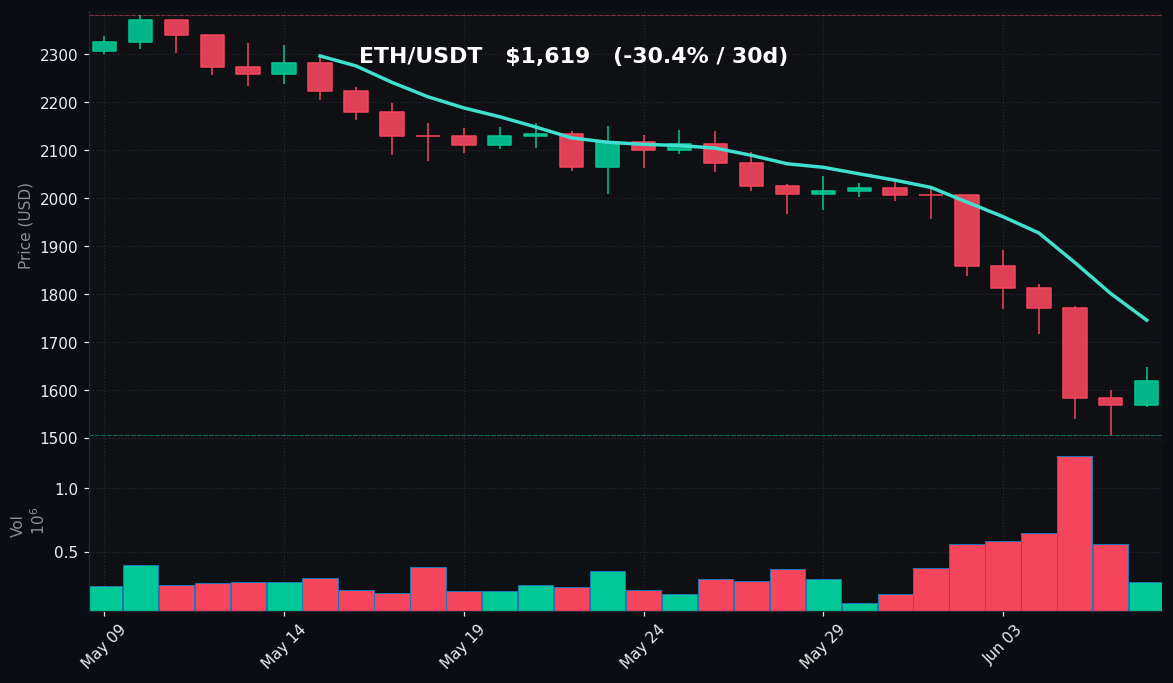
TradingView Live (4h)
Ethereum's situation mirrors Bitcoin's but with even greater severity. Trading at $1,619, ETH has lost 19.32% over the past week and 30.40% over 30 days, making it the weaker performer of the two. The 24-hour high of $1,649 and low of $1,564 show that the asset is attempting to stabilize after hitting a 7-day and 30-day low of $1,506. This low is a critical level, as it represents a 36.8% decline from the 30-day high of $2,383.
Technically, ETH is deeply below its moving averages: 7.3% below the 7-day MA of $1,746 and 21.3% below the 30-day MA of $2,056. The RSI(14) of 11.9 is also in extreme oversold territory, but slightly less extreme than Bitcoin's. This suggests that while both assets are oversold, ETH may have slightly less downside momentum in the very short term. However, the volume is even weaker than BTC's, at only 0.44x the 7-day average, indicating that the bounce is occurring on thin liquidity.
Ethereum's support structure is fragile. The immediate support is the $1,506 low, followed by the $1,450 level (a prior support from late 2024) and the psychological $1,400 zone. Resistance levels are at the 7-day MA of $1,746, then the $1,800 area, and finally the 30-day MA at $2,056. The RSI divergence is worth noting: ETH's RSI is higher than BTC's (11.9 vs 8.5) despite ETH having a larger 24-hour gain (3.15% vs 1.47%). This could indicate that ETH is seeing slightly stronger buying interest relative to its recent losses, but the low volume tempers any bullish interpretation.
The broader trend for ETH remains bearish, with a series of lower highs and lower lows since the $2,383 peak. The asset is now trading near the lower end of its 12-month range, and a break below $1,506 would open the door to $1,400 and potentially $1,200. Conversely, a reclaim of the 7-day MA would be the first sign of a potential short-term bottom.
Key Technical Levels
| Asset | Support | Resistance | RSI |
|---|---|---|---|
| BTC | $59,131 / $58,000 | $64,274 / $67,000 | Oversold (8.5) |
| ETH | $1,506 / $1,450 | $1,746 / $1,800 | Oversold (11.9) |
BTC vs ETH Dynamic
The correlation between Bitcoin and Ethereum remains high, as both assets are experiencing similar macro-driven selling pressure. However, there are subtle divergences. In the last 24 hours, ETH has outperformed BTC with a 3.15% gain versus BTC's 1.47%, suggesting that traders are rotating into ETH as a higher-beta play in anticipation of a potential bounce. Yet, over the 7-day and 30-day periods, ETH has underperformed BTC, losing 19.32% vs 16.15% and 30.40% vs 23.43%, respectively. This indicates that ETH's beta to BTC is above 1, meaning it amplifies both upside and downside moves. The RSI divergence (ETH 11.9 vs BTC 8.5) also suggests that ETH may be slightly less oversold in relative terms, but both are in deep distress. The ETH/BTC ratio has fallen to 0.0262, near its lowest levels in months, reflecting the market's preference for Bitcoin as a relative safe haven during this correction.
Strategy Fit
Given the extreme oversold conditions and low volume bounce, the current market environment favors mean-reversion and range-bound strategies over trend-following approaches. The RSI readings below 10 for BTC and near 12 for ETH are historically associated with short-term bounces, but the low volume (0.52x and 0.44x of average) suggests that any rally may be shallow and short-lived. A grid trading strategy is well-suited for this environment, as it can profit from the expected increased volatility within a defined range. For example, a grid bot set between $59,000 and $65,000 for BTC, or $1,500 and $1,750 for ETH, can capture the oscillations without taking directional risk.
Alternatively, a DCA (Dollar-Cost Averaging) strategy is appropriate for long-term accumulators, as the current prices are near multi-month lows. However, traders should be cautious about deploying full capital due to the risk of further downside. Pionex's built-in grid trading bots and DCA bots are ideal for these conditions, allowing users to automate positions without emotional interference. Trend-following strategies are not recommended until the price reclaims the 7-day moving averages with volume confirmation. The extreme oversold conditions argue against shorting, but a lack of volume also argues against aggressive long positions. A balanced approach using grid bots with tight ranges is the most prudent fit for today's market.
Risk Disclaimer
This market recap is for informational and educational purposes only. It does not constitute financial advice, investment recommendations, or solicitation to buy or sell any asset. Cryptocurrency markets are highly volatile and involve substantial risk, including the potential loss of principal. Past performance is not indicative of future results. All trading decisions should be made based on your own research and risk tolerance. Consult a qualified financial advisor before making any investment decisions.
FAQ
Q: Why is the RSI for BTC so low at 8.5, and what does it mean?
A: An RSI (Relative Strength Index) of 8.5 indicates that Bitcoin is in extremely oversold territory, meaning the asset has experienced rapid and severe selling pressure. Historically, such low readings (below 10) are rare and have often preceded short-term bounces, but they do not guarantee a reversal. The RSI measures the speed and magnitude of recent price changes; a reading this low suggests that selling has been exhausted in the near term, but the trend remains bearish.
Q: Is the 24-hour bounce in BTC and ETH a sign of a bottom?
A: The 24-hour bounce is a positive short-term signal, but it is occurring on below-average volume (BTC 0.52x and ETH 0.44x of their 7-day averages). Low-volume bounces during a downtrend are often considered "dead cat bounces" and may not indicate a true bottom. A sustainable bottom would typically require higher volume and a reclaim of key moving averages, such as the 7-day MA.
Q: What are the key levels to watch for BTC and ETH?
A: For BTC, the key support is $59,131 (recent low) and resistance at $64,274 (7-day MA). For ETH, support is at $1,506 (recent low) and resistance at $1,746 (7-day MA). A break below support would signal further downside, while a break above resistance with volume would suggest a short-term trend change.
Q: Why is ETH underperforming BTC over the past month?
A: ETH has a higher beta to BTC, meaning it tends to amplify BTC's moves. Over the past 30 days, BTC fell 23.43%, while ETH fell 30.40%, reflecting this higher volatility. Additionally, Ethereum faces specific headwinds, including lower network activity and competition from other layer-1 blockchains, which have exacerbated its decline relative to Bitcoin.
Q: What trading strategies are best suited for this market condition?
A: Given the extreme oversold conditions and low volume, grid trading within a defined range is a suitable strategy to capture volatility without directional bias. DCA (Dollar-Cost Averaging) is also appropriate for long-term accumulation at these lower prices. Trend-following strategies are not recommended until the price reclaims the 7-day moving averages with strong volume. Pionex's automated grid and DCA bots can help execute these strategies efficiently.