BTC ETH Daily Recap — June 29, 2026

BTC ETH Daily Recap — June 29, 2026
Today at a Glance
The cryptocurrency market opened the final week of June under persistent selling pressure, with both Bitcoin and Ethereum extending their monthly declines. Bitcoin (BTC) is trading at $59,430, down 0.25% in the last 24 hours, after touching a low of $58,900 and a high of $60,781. The leading digital asset has lost 7.17% over the past seven days and 19.33% over the past 30 days, retreating sharply from its 30-day high of $74,276. Ethereum (ETH) is slightly softer at $1,570, down 0.15% on the day, with a 24-hour range of $1,550 to $1,597. ETH’s weekly decline stands at 9.18%, while its 30-day drawdown is 21.80%, reflecting a more pronounced relative weakness compared to Bitcoin. Both assets are trading well below their key moving averages, with RSI readings deep in oversold territory—BTC at 20.3 and ETH at 17.7—indicating extreme bearish momentum. Trading volumes remain subdued, at 0.61x and 0.52x of their respective 7-day averages, suggesting a lack of conviction among buyers.
Bitcoin Analysis
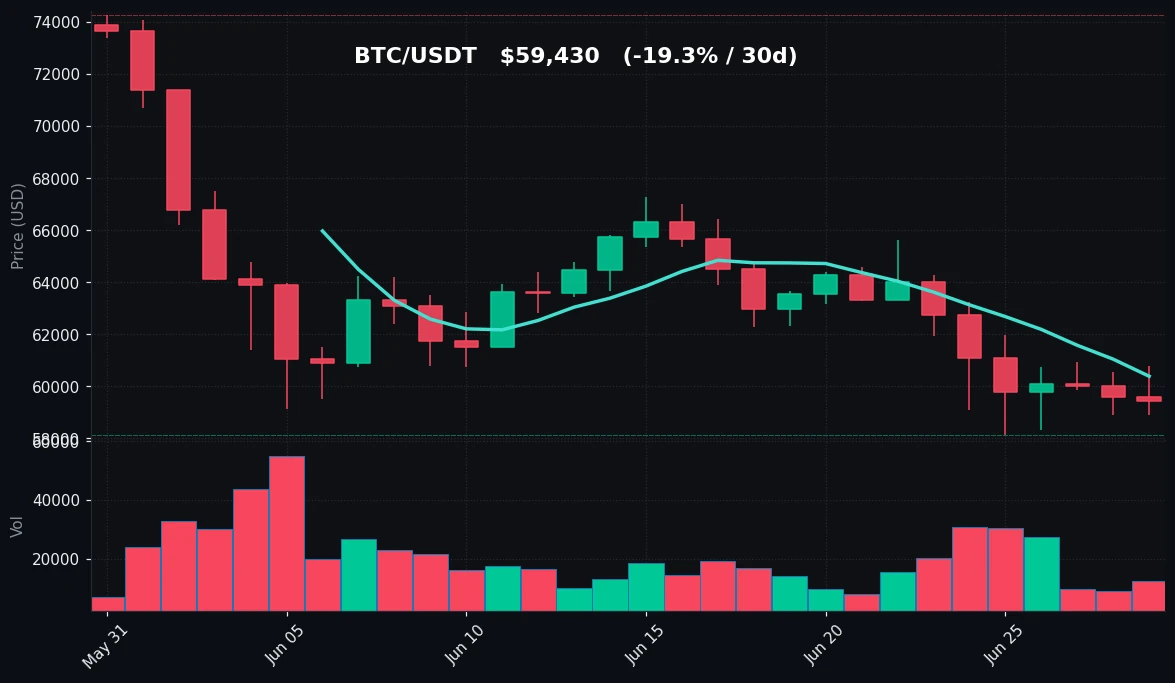
TradingView Live (4h)
Bitcoin’s technical landscape continues to deteriorate as the price remains firmly below both its 7-day moving average (MA7) of $60,391 and its 30-day moving average (MA30) of $63,542. The current price of $59,430 sits $961 below the MA7 and $4,112 below the MA30, confirming a bearish short- to medium-term trend. The 7-day range of $58,115 to $64,275 shows that Bitcoin has been unable to reclaim the $60,000 level as support, with intraday attempts to rally above $60,000 being met with selling pressure, as evidenced by the 24-hour high of $60,781.
The 30-day high of $74,276—recorded approximately one month ago—now appears distant, and the asset has shed over $15,000 in value since that peak. The 30-day low of $58,115 was tested on June 25, and the price is currently hovering just $1,315 above that level, leaving the potential for a retest of support if selling continues. The RSI(14) reading of 20.3 is deeply oversold, historically a zone that has preceded short-term bounces or consolidation. However, in a downtrend, oversold conditions can persist as prices grind lower.
Volume is notably weak, at 0.61x the 7-day average. This low participation suggests that the current move is driven more by a lack of buying interest than by aggressive selling. Without a catalyst—such as macroeconomic news, regulatory clarity, or institutional accumulation—BTC may continue to drift lower or trade in a narrow range near the $58,000–$60,000 zone. Key resistance remains at the MA7 of $60,391, followed by the MA30 at $63,542. On the downside, the 30-day low at $58,115 and the psychological $58,000 level serve as immediate support.
Ethereum Analysis
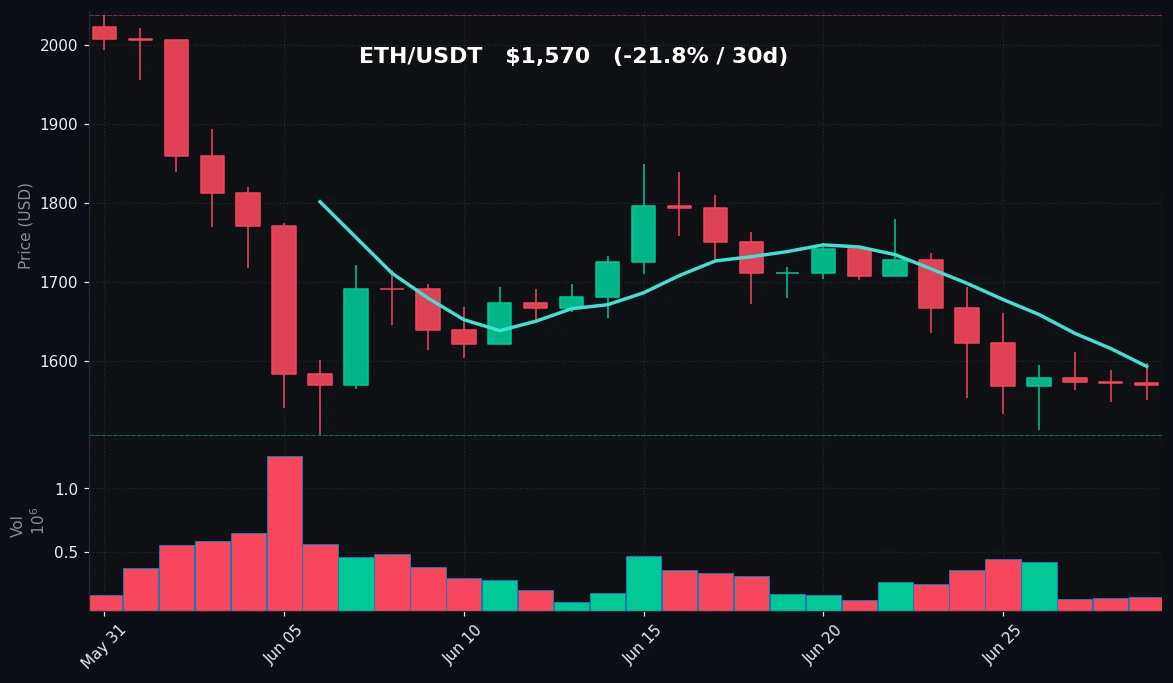
TradingView Live (4h)
Ethereum is experiencing an even more pronounced bearish phase than Bitcoin. At $1,570, ETH is trading $23 below its MA7 of $1,593 and $133 below its MA30 of $1,703. The 7-day decline of 9.18% outpaces Bitcoin’s 7.17%, underscoring ETH’s relative underperformance. The 24-hour range of $1,550 to $1,597 is narrow, reflecting low volatility and indecision, while the 7-day high of $1,736 and low of $1,512 illustrate the asset’s struggle to hold above the $1,600 level.
Over the past 30 days, Ethereum has fallen 21.80%, from a high of $2,038 to a low of $1,506. This 26% peak-to-trough decline within the month highlights significant selling pressure. The current price is only $64 above the 30-day low, placing ETH in a precarious position. A break below $1,506 would open the door to lower support levels near $1,450, an area that has not been tested since late 2023.
The RSI(14) for ETH stands at 17.7, even more oversold than Bitcoin. This is a rare reading that typically indicates extreme bearish sentiment and potential exhaustion among sellers. However, as with BTC, oversold conditions in a downtrend can persist. Volume is 0.52x the 7-day average, the lowest relative reading among the two assets, suggesting that the current price action is characterized by thin liquidity and a lack of directional conviction.
Resistance is clustered at the MA7 of $1,593 and the $1,600 round number. A move above $1,600 would be the first bullish signal in weeks, but would need to be accompanied by a surge in volume to be sustainable. Support lies at the 30-day low of $1,506 and the psychological $1,500 level. Given the extreme RSI and low volume, ETH may be poised for a short-term bounce, but the broader trend remains firmly bearish.
Key Technical Levels
| Asset | Support | Resistance | RSI |
|---|---|---|---|
| BTC | $58,115 / $58,000 | $60,391 (MA7) / $63,542 (MA30) | oversold (20.3) |
| ETH | $1,506 (30d low) / $1,500 | $1,593 (MA7) / $1,703 (MA30) | oversold (17.7) |
BTC vs ETH Dynamic
Bitcoin and Ethereum remain highly correlated in this bearish phase, with both assets experiencing simultaneous drawdowns. However, ETH is declining at a faster pace, evidenced by its larger 7-day and 30-day percentage losses. The ETH/BTC ratio has compressed, reflecting a risk-off tilt within the crypto market where traders favor BTC’s relative stability over ETH’s higher beta. In the current environment, Bitcoin is acting as a relative safe haven, while Ethereum is bearing the brunt of speculative unwinding. Correlation remains above 0.90, meaning any directional move in BTC is likely to be mirrored by ETH, albeit with amplified magnitude.
Strategy Fit
Given the extreme oversold readings on both BTC (RSI 20.3) and ETH (RSI 17.7), combined with low volume and a clear downtrend, aggressive directional trading carries elevated risk. A grid trading strategy is well-suited to this environment, as it allows traders to profit from mean reversion and range-bound price action without predicting the exact bottom. On Pionex, setting a neutral grid around the current price—for example, between $58,000 and $61,000 for BTC, and $1,500 and $1,600 for ETH—can capture volatility while limiting downside exposure. For those with a longer horizon, a DCA (Dollar-Cost Averaging) bot can accumulate positions at lower average prices during this dip, benefiting from potential recovery. Trend-following strategies are not recommended given the lack of clear directional momentum and low volume. Pionex’s built-in grid and DCA bots offer automated, low-maintenance execution that aligns with the current low-volatility, high-uncertainty market conditions.
Risk Disclaimer
This market recap is for informational and educational purposes only and does not constitute financial advice, investment recommendation, or solicitation to buy or sell any digital assets. Cryptocurrency markets are highly volatile and carry substantial risk, including the potential loss of principal. Past performance is not indicative of future results. Always conduct your own research and consult with a qualified financial advisor before making any investment decisions. The technical indicators and levels referenced are based on historical data and may not accurately predict future price movements.
FAQ
Q: Why are BTC and ETH RSI values so low?
A: The RSI(14) readings of 20.3 for BTC and 17.7 for ETH indicate that both assets are deeply oversold after sustained selling pressure over the past 30 days. This typically suggests that the price has fallen too far, too fast, and may be due for a technical bounce or consolidation. However, oversold conditions can persist in strong downtrends.
Q: What does the low volume (0.61x and 0.52x of 7d avg) mean?
A: Low relative volume indicates reduced market participation. This can mean that the current price declines are driven more by a lack of buying interest than aggressive selling. It also suggests that any move—up or down—may lack conviction until volume picks up.
Q: Is $58,000 a strong support for Bitcoin?
A: The $58,000 area corresponds to the 30-day low of $58,115 and is a psychological round number. It has held as support in recent days, but repeated tests could weaken it. A break below would open the door to the next support zone near $56,000–$57,000.
Q: How does Ethereum’s performance compare to Bitcoin this month?
A: Ethereum has underperformed Bitcoin over the past 30 days, with a 21.80% decline versus Bitcoin’s 19.33%. This is typical in risk-off environments, as ETH has higher beta and is more sensitive to speculative flows.
Q: What trading strategies are appropriate in this market?
A: Given the oversold conditions and low volume, grid trading and DCA are the most suitable strategies. Grid trading profits from range-bound movements, while DCA accumulates positions over time. Trend-following is not recommended due to the lack of clear directional momentum. Pionex offers automated bots for both strategies.


