BTC ETH Daily Recap – June 4, 2026
BTC ETH Daily Recap – June 4, 2026
Today at a Glance
The cryptocurrency market continues to exhibit significant bearish pressure on June 4, 2026, with both Bitcoin and Ethereum trading near multi-week lows. Bitcoin (BTC) is currently priced at $64,292, recovering marginally by +0.23% over the past 24 hours after touching an intraday low of $61,384. Despite this minor bounce, BTC remains deeply oversold with a 14-day RSI of 13.1, the lowest reading in months, while trading 12.67% lower over the past week and 21.06% lower over the past 30 days. Ethereum (ETH) is trading at $1,788, down 1.38% in the last 24 hours, with a 7-day decline of 11.04% and a 30-day drop of 23.94%. ETH’s RSI of 15.5 also signals extreme oversold conditions. Trading volumes have surged significantly—BTC volume is 1.71x its 7-day average and ETH volume is 1.43x its 7-day average—indicating heightened market activity and potential capitulation. Both assets are trading well below their 7-day and 30-day moving averages, confirming a sustained downtrend. The intraday ranges were wide, with BTC hitting a high of $64,764 and ETH reaching $1,820, but both failed to hold gains, suggesting persistent selling pressure.
Bitcoin Analysis
TradingView Live (4h)
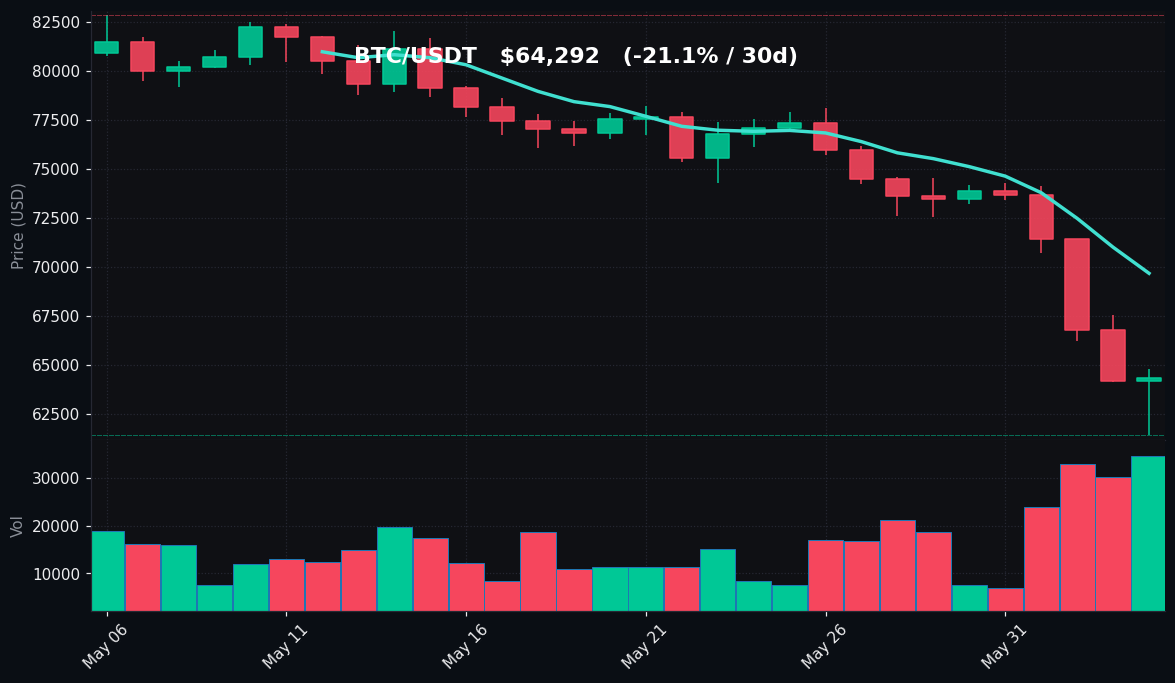
Bitcoin’s price action on June 4, 2026, reflects a market in distress, with the leading cryptocurrency trading at $64,292 after a volatile session that saw a low of $61,384 and a high of $64,764. The 24-hour change of +0.23% is a marginal recovery from intraday lows, but the broader trend remains decisively bearish. Over the past seven days, BTC has lost 12.67% of its value, and over the past 30 days, the decline has deepened to 21.06%. The 7-day high of $74,514 and the 30-day high of $82,850 are now distant memory, as the asset has consistently made lower highs and lower lows.
Key technical levels underscore the severity of the sell-off. The 7-day moving average (MA7) stands at $69,661, and the 30-day moving average (MA30) is at $76,307. BTC is currently trading 7.7% below its MA7 and 15.7% below its MA30, confirming a bearish crossover and sustained downward momentum. The distance from these averages indicates that the market has not yet found a stable floor.
The Relative Strength Index (RSI) for BTC is at 13.1, which is deep into oversold territory (below 30). This is an extreme reading that historically has preceded short-term bounces, but it also reflects persistent selling pressure without significant buying interest. The last time RSI was this low was during the market turmoil of mid-2024, which was followed by a sharp but brief recovery. However, in a sustained downtrend, oversold conditions can persist, and further downside cannot be ruled out.
Volume is a critical factor today. BTC’s trading volume is 1.71 times its 7-day average, indicating a significant increase in market participation. This surge in volume during a price decline is characteristic of capitulation selling, where late-stage sellers exit positions, often marking a potential bottom. The 24-hour range of $61,384 to $64,764 is wide, reflecting heightened volatility and uncertainty. The low of $61,384 is a key psychological and technical level; a break below this could open the door to further declines toward the $58,000-$60,000 zone. On the upside, resistance is now at the $64,764 high of the day, followed by the MA7 at $69,661, which would require a 8.4% rally to reclaim.
Ethereum Analysis
TradingView Live (4h)
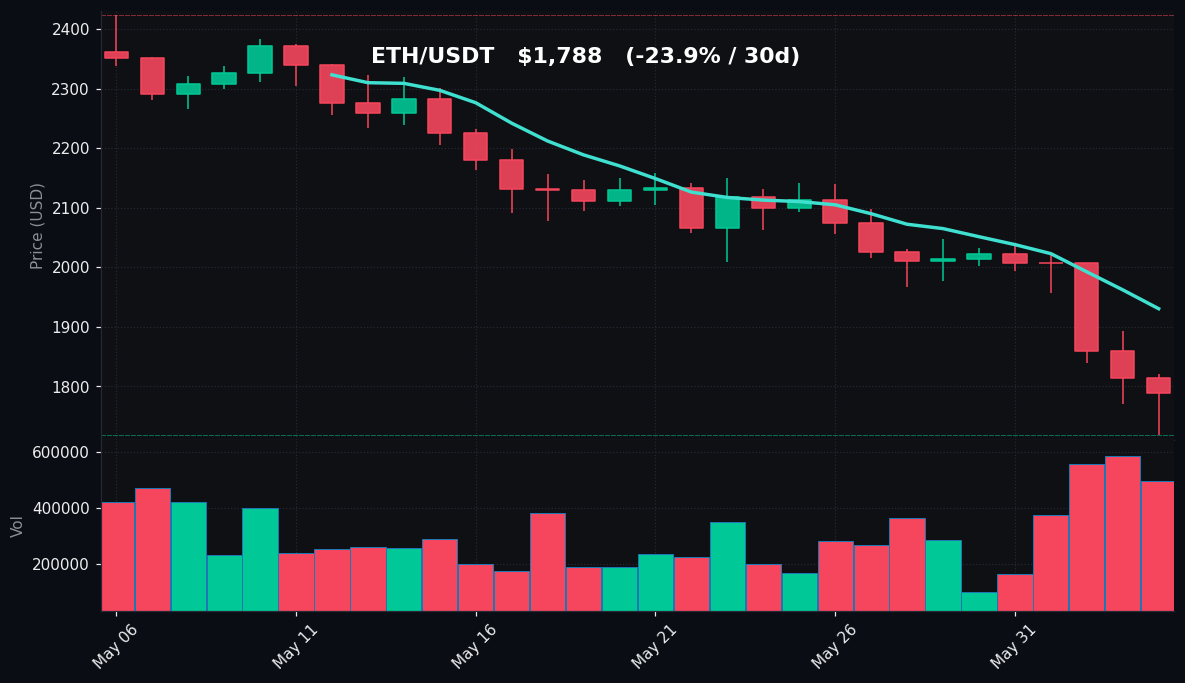
Ethereum is trading at $1,788, down 1.38% in the last 24 hours, and has been under even more severe pressure than Bitcoin over the same periods. The 7-day decline of 11.04% and 30-day decline of 23.94% highlight a persistent downtrend that has erased months of gains. The intraday range of $1,717 to $1,820 shows that ETH attempted a recovery but failed to sustain momentum, closing near the lower end of the range.
Technical indicators for ETH paint a similarly bleak picture. The 7-day moving average (MA7) is at $1,930, and the 30-day moving average (MA30) is at $2,129. ETH is currently trading 7.4% below its MA7 and 16.0% below its MA30. The distance from these averages is comparable to Bitcoin’s, indicating that both assets are moving in lockstep in this bearish phase. The 30-day high of $2,424 is now 26.2% above the current price, underscoring the magnitude of the sell-off.
The RSI for ETH is at 15.5, also deep in oversold territory (below 30). This is slightly higher than BTC’s RSI but still indicative of extreme bearish sentiment. The last time ETH’s RSI was this low was during the same period as BTC’s in mid-2024, and a similar pattern of a sharp bounce followed. However, the current macro environment may differ, and oversold conditions alone are not a buy signal.
Volume for ETH is 1.43 times its 7-day average, a significant increase but slightly less dramatic than BTC’s volume surge. This suggests that while selling pressure is elevated, it may not be as intense as in Bitcoin. The 24-hour low of $1,717 is a critical support level; a break below this could target the $1,600-$1,650 zone, which was a previous consolidation area from late 2025. Resistance is at the day’s high of $1,820, followed by the MA7 at $1,930, which would require a 7.9% rally to reclaim.
Key Technical Levels
| Asset | Support | Resistance | RSI |
|---|---|---|---|
| BTC | $61,384 | $64,764 | Oversold (13.1) |
| ETH | $1,717 | $1,820 | Oversold (15.5) |
BTC vs ETH Dynamic
Bitcoin and Ethereum are exhibiting a high degree of correlation in the current market environment, with both assets experiencing similar percentage declines over the past 7 and 30 days. BTC’s 7-day decline of 12.67% and ETH’s 11.04% are within a narrow range, and the 30-day drops of 21.06% and 23.94% respectively show that ETH is slightly underperforming BTC. The RSI levels are also close, with BTC at 13.1 and ETH at 15.5, both in extreme oversold territory. However, the volume surge is more pronounced in BTC (1.71x vs 1.43x), suggesting that Bitcoin is seeing more active capitulation, which could make it the leading indicator for a potential reversal. Historically, when BTC leads with higher volume and deeper oversold conditions, ETH often follows with a lag, but both remain highly correlated in the short term. The current dynamic suggests that traders are treating both assets as a single risk-on basket, with macro factors driving the sell-off rather than asset-specific news.
Strategy Fit
Given the extreme oversold conditions and elevated volatility, the current market environment is best suited for grid trading and DCA (Dollar-Cost Averaging) strategies, rather than trend-following approaches. The deep RSI readings (13.1 for BTC, 15.5 for ETH) and wide intraday ranges suggest that sharp bounces are possible but difficult to time, making trend-following risky. Grid trading, which benefits from volatility by placing buy and sell orders within a defined range, can capture profits from the wild price swings without predicting direction. On Pionex, the Infinity Grid Bot is particularly useful in such conditions, as it allows for unlimited buy orders below the current price to accumulate during dips, while selling into spikes. Alternatively, the DCA Bot can systematically accumulate BTC and ETH at lower prices, averaging out the entry cost over time. For more aggressive traders, the Reverse Grid Bot could be considered to profit from downward moves, but this carries higher risk. The key is to avoid leverage and directional bets, as the market could either bounce sharply or continue lower. A neutral, volatility-focused approach is most appropriate today.
Risk Disclaimer
This market recap is for informational and educational purposes only and does not constitute financial or investment advice. Cryptocurrency trading involves substantial risk, including the potential loss of principal. Past performance and technical indicators are not guarantees of future results. The data presented is based on publicly available information and may contain errors or omissions. Always conduct your own research and consult with a qualified financial advisor before making any investment decisions. Trading strategies mentioned, including grid trading and DCA, carry their own risks and may not be suitable for all investors. The author and platform assume no liability for any losses incurred from the use of this information.
FAQ
Q: Why are BTC and ETH RSI levels so low (13.1 and 15.5)?
A: RSI below 30 indicates oversold conditions, meaning the asset has experienced sustained selling pressure without a significant bounce. The current readings are extreme and suggest that sellers have dominated for an extended period, often associated with capitulation or panic selling. Such low levels can precede a short-term bounce, but they can also persist in a strong downtrend.
Q: What does the volume surge (1.71x for BTC) mean?
A: Volume surging 1.71 times the 7-day average during a price decline indicates heightened market activity, often interpreted as capitulation selling. This means many traders are exiting positions at once, which can mark a potential bottom if buyers step in. However, it can also signal continued selling pressure if the trend continues.
Q: Is the $61,384 level important for Bitcoin?
A: Yes, $61,384 is the 24-hour low and a key support level. A break below this could open the door to further declines toward $58,000-$60,000, which were previous support zones from mid-2025. Conversely, holding above this level could lead to a bounce toward $64,764 resistance.
Q: How do the MA7 and MA30 levels affect trading?
A: The MA7 ($69,661 for BTC) and MA30 ($76,307 for BTC) are moving averages that act as dynamic resistance in a downtrend. Prices trading below both averages confirm bearish momentum. Reclaiming these levels would be a bullish signal, but until then, the trend remains downward.
Q: Should I buy the dip with these oversold readings?
A: Oversold readings do not guarantee a bounce; they only indicate that the asset is cheap relative to recent prices. Buying the dip carries risk if the downtrend continues. A disciplined approach like DCA or grid trading can help manage risk by averaging entries over time, rather than making a single directional bet.