BTC ETH Daily Recap – June 10, 2026
BTC ETH Daily Recap – June 10, 2026
Today at a Glance
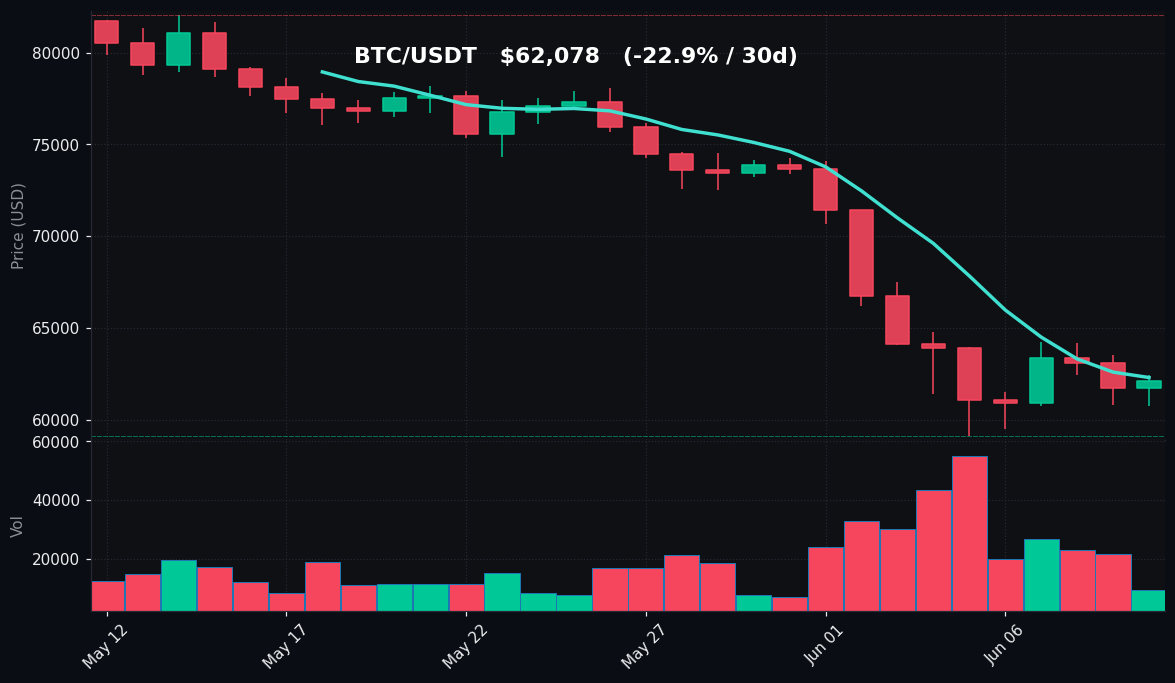
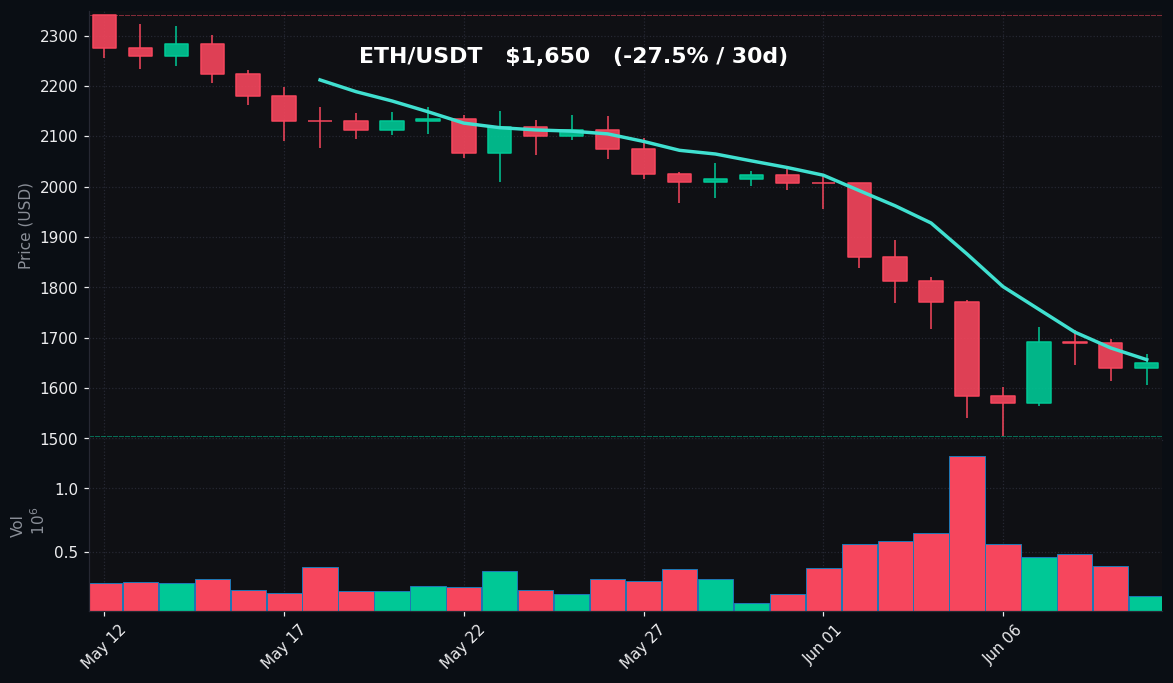
Bitcoin and Ethereum experienced modest intraday recoveries on June 10, 2026, with BTC rising 0.56% to $62,078 and ETH gaining 0.65% to $1,650. Despite these slight green candles, the broader picture remains deeply bearish. BTC has shed 22.89% over the past 30 days, while ETH has lost 27.46% in the same period. Both assets are trading well below their respective 30-day moving averages (BTC MA30: $72,490; ETH MA30: $1,989). Critically, the Relative Strength Index (RSI) for BTC sits at 17.1 and for ETH at 21.7—both firmly in oversold territory (<30). Trading volumes have collapsed to just 0.3x (BTC) and 0.24x (ETH) of their 7-day averages, signaling a severe lack of market participation. The 24-hour ranges were tight: BTC oscillated between $60,755 and $62,446, while ETH ranged $1,606 to $1,668. The 7-day lows for both assets ($59,131 for BTC, $1,506 for ETH) remain the most critical support levels to watch.
Bitcoin Analysis
TradingView Live (4h)
Bitcoin’s price action on June 10 reflects a market in a state of exhaustion. After hitting a 7-day low of $59,131 earlier in the week, BTC staged a partial recovery to the $62,000 zone, but the recovery lacks conviction. The price is currently $62,078, virtually flat against its 7-day moving average of $62,293. This convergence with the MA7 suggests that short-term momentum is stalling, and the asset is at a decision point. The 30-day MA at $72,490 is far above current levels, confirming the bearish medium-term trend. The gap between price and MA30 is over $10,000, or roughly 14%, indicating that the market has not yet found equilibrium.
Volume data paints a stark picture. Today’s trading volume is only 0.3x the 7-day average, meaning that the market is operating at 30% of its recent participation levels. Low volume during a recovery often signals that the move is not supported by genuine buying interest—it may be short-covering or algorithmic repositioning rather than fresh capital entering. The 24-hour high of $62,446 was tested but rejected, and the low of $60,755 held, forming a narrow range that suggests indecision.
The RSI of 17.1 is deeply oversold. Historically, BTC has seen RSI readings below 20 only a handful of times (e.g., March 2020, May 2021, November 2022). Each instance was followed by a sharp bounce, but that bounce was not always sustained. The current context is different: the 30-day decline of nearly 23% is severe, and the RSI has been below 30 for several days. An oversold reading alone does not guarantee a reversal; it only indicates that the selling pressure has been extreme and that a mean-reversion bounce is statistically more likely. However, without volume catalysts (macro news, ETF flows, regulatory clarity), the bounce may be shallow.
Key technical levels to monitor: immediate resistance at $62,446 (today’s high), then $64,764 (7-day high). On the downside, $60,755 (today’s low) is the first support, followed by the critical $59,131 (7-day low). A break below $59,131 would open the door to the psychological $58,000 area and potentially the 30-day low of $59,131 (which is also the 7-day low). The lack of volume makes any breakout or breakdown less reliable.
Ethereum Analysis
TradingView Live (4h)
Ethereum’s situation is even more precarious than Bitcoin’s. ETH is trading at $1,650, down 8.98% over the past week and 27.46% over the past month. The 24-hour range of $1,606 to $1,668 shows that the asset is struggling to reclaim the $1,700 level, which was a support-turned-resistance zone from early May. The 7-day moving average of $1,656 is essentially at the current price, indicating that short-term momentum has flatlined. The 30-day MA of $1,989 is a staggering $339 above the current price, meaning ETH is trading nearly 17% below its medium-term average—a bearish structural condition.
Volume is even weaker than BTC: today’s volume is just 0.24x the 7-day average. This is a 76% reduction in activity. Such low volume during a period of price decline suggests that the selling pressure is not aggressive, but rather that buyers are absent. The market is in a “drift” phase where price moves on thin liquidity. The 24-hour high of $1,668 was rejected cleanly, and the low of $1,606 held, but barely. The 7-day low of $1,506 is the most important support level; a break below that would target the $1,500 psychological level and potentially $1,450.
The RSI of 21.7 is deeply oversold, even more so than BTC’s. ETH has been below 30 since June 5, and the current reading is the lowest since the FTX crash in November 2022. Oversold conditions in ETH have historically led to sharp but short-lived bounces. However, the lack of volume and the absence of any fundamental catalyst (e.g., Ethereum ETF flows, network upgrade news) make a sustained recovery unlikely. The divergence between BTC and ETH is also notable: BTC has held its 7-day low better than ETH, which has broken down more aggressively.
Key levels: resistance at $1,668 (daily high), then $1,820 (7-day high). Support at $1,606 (daily low), then $1,506 (7-day low). The $1,500 area is a major psychological round number that could attract buyers, but also could break under selling pressure.
Key Technical Levels
| Asset | Support | Resistance | RSI |
|---|---|---|---|
| BTC | $59,131 | $64,764 | Oversold (17.1) |
| ETH | $1,506 | $1,820 | Oversold (21.7) |
BTC vs ETH Dynamic
The correlation between Bitcoin and Ethereum remains high, but the magnitude of the moves diverges. Over the past 30 days, BTC has declined 22.89% while ETH has fallen 27.46%, meaning ETH has underperformed by roughly 4.6 percentage points. This “ETH beta” behavior—where ETH amplifies BTC moves—is typical in bearish phases. However, today’s 24-hour performance is nearly identical (+0.56% vs +0.65%), suggesting a temporary convergence. The RSI gap (17.1 vs 21.7) indicates that BTC is more oversold on a relative basis, which could lead to a short-term outperformance of BTC if a bounce materializes. The volume disparity (BTC at 0.3x vs ETH at 0.24x) also favors BTC in terms of liquidity. Overall, the market is not seeing any decoupling; both assets are moving in lockstep, with ETH taking the larger hit on the downside.
Strategy Fit
Given the extreme oversold conditions and low volume, the current market environment is best suited for grid trading and DCA (Dollar Cost Averaging) strategies, rather than trend-following approaches.
-
Grid Trading: The tight 24-hour ranges (BTC: $60,755–$62,446; ETH: $1,606–$1,668) present opportunities for grid bots to capture small profits from mean reversion. The low volatility and sideways drift are ideal for a narrow grid with tight spacing (e.g., 0.3%–0.5% per grid level). Pionex’s Infinity Grid bot can be set with a price range that encompasses the 7-day low and the 7-day high, allowing the bot to accumulate positions near support and sell near resistance. The oversold RSI increases the probability of a bounce, making grid longs a reasonable approach.
-
DCA: For longer-term accumulation, a DCA bot is appropriate. The 30-day decline of 22–27% means that buying at current levels reduces the average cost. A daily or weekly DCA into BTC and/or ETH, with a price-based trigger (e.g., buy more if price drops 5% below the current level), can capitalize on further weakness. Pionex’s DCA bot allows users to set a target allocation and automatically execute buys at set intervals or price thresholds.
-
Trend-following is not recommended. The RSI is oversold, but the price is below both MA7 and MA30, and volume is collapsing. A trend-following strategy (e.g., moving average crossovers) would have generated false signals in this low-volume, choppy environment. Shorting is also risky given the oversold conditions.
-
Arbitrage opportunities are minimal due to low volatility and the absence of significant price dislocations between exchanges.
Pionex users can leverage the Grid Trading Bot with a neutral-to-long bias, or the DCA Bot for systematic accumulation. For those with higher risk tolerance, a Rebalancing Bot between BTC and ETH could capture the relative performance divergence (ETH underperformance), but this is a more advanced strategy.
Risk Disclaimer
This market recap is for informational and educational purposes only. It does not constitute financial advice, investment recommendations, or solicitation to buy or sell any digital assets. Cryptocurrency markets are highly volatile and involve substantial risk of loss. Past performance is not indicative of future results. All trading strategies, including grid trading, DCA, and trend-following, carry inherent risks. You should conduct your own research and consult with a qualified financial advisor before making any investment decisions. The data presented is sourced from public exchanges and may contain delays or errors. The author and platform disclaim any liability for losses incurred based on this content.
FAQ
Q1: Why is the RSI so low but the price not bouncing?
Low RSI indicates oversold conditions, but a bounce requires buying pressure. Today’s volume is only 30% of average (BTC) and 24% (ETH), meaning there are few buyers to push prices up. Oversold can persist in a low-volume bear market.
Q2: Should I buy the dip at these levels?
This is not a recommendation. Buying at oversold levels has historically worked, but the current environment lacks catalysts. If you believe in long-term value, DCA over weeks may reduce timing risk. Never invest more than you can afford to lose.
Q3: What is the significance of the $59,131 (BTC) and $1,506 (ETH) support levels?
These are the 7-day lows, which also coincide with the 30-day lows for both assets. A break below these levels would set new multi-month lows and likely trigger stop-losses, accelerating declines. They are critical technical floors.
Q4: Why is volume so low? Is this normal?
Low volume during a bearish phase is common. It indicates that traders are sitting on the sidelines, waiting for a clearer signal (e.g., macro news, ETF approvals, exchange inflows). It can also be a sign of “seller exhaustion,” where those who wanted to sell have already sold.
Q5: What is the best bot strategy for this market?
Given the tight ranges and low volatility, a Grid Trading Bot with a narrow range (e.g., $60,000–$63,000 for BTC) is suitable for capturing small profits from mean reversion. For longer-term accumulation, a DCA Bot with a daily buy order at current prices or a price-triggered buy at lower levels is prudent. Avoid trend-following bots in this environment.