BTC ETH Daily Recap: May 26, 2026 – Sideways Drift with Oversold Signals
BTC ETH Daily Recap: May 26, 2026 – Sideways Drift with Oversold Signals
Today at a Glance
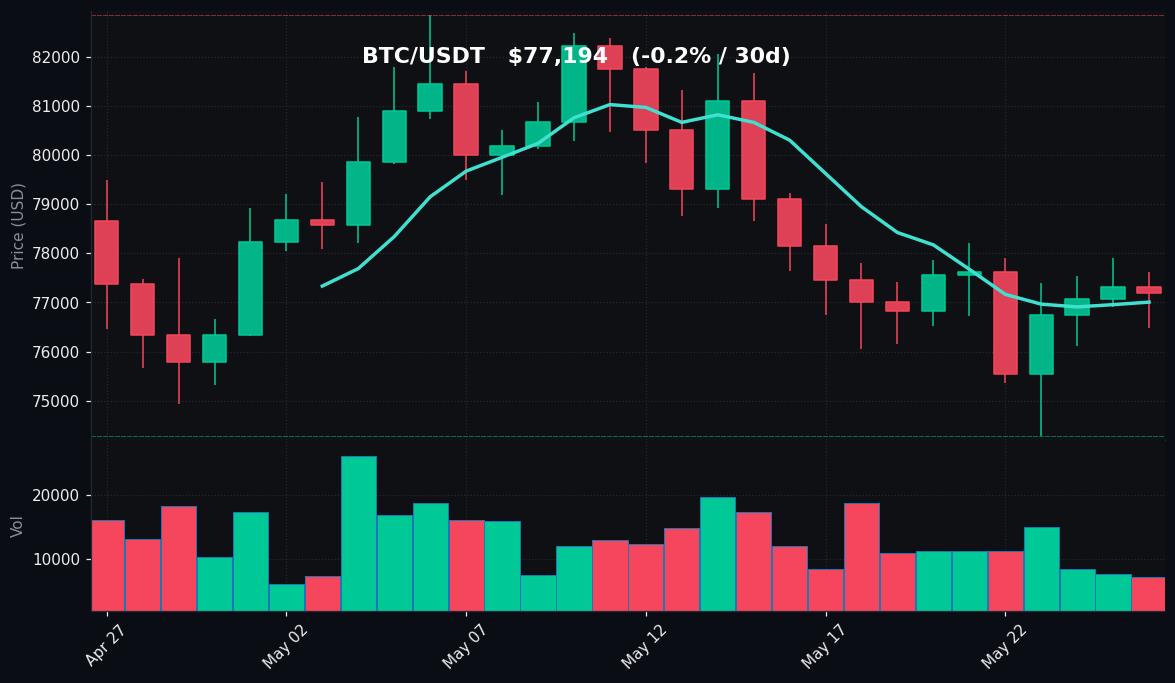
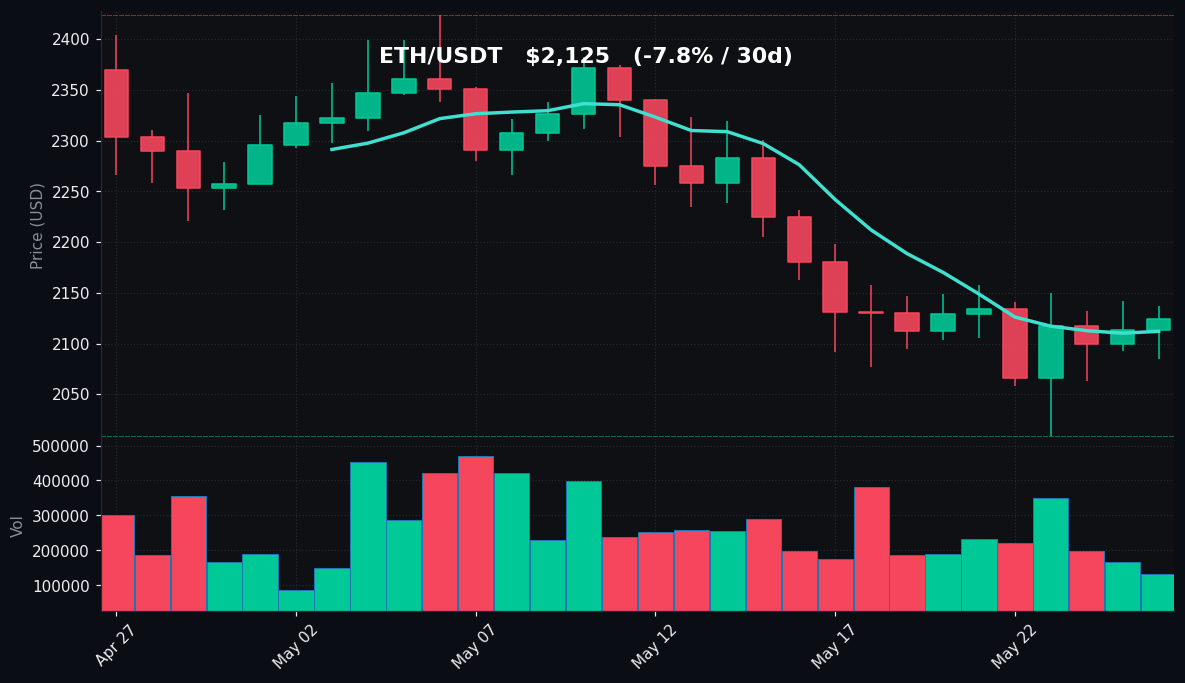
The cryptocurrency market on May 26, 2026, exhibited a muted session, with Bitcoin (BTC) and Ethereum (ETH) trading in narrow ranges and showing minimal directional bias. Bitcoin posted a slight 0.17% decline over the past 24 hours, settling at $77,194, after touching a session high of $77,622 and a low of $76,476. The asset remains virtually flat on the weekly and monthly timeframes, with a 7-day change of +0.47% and a 30-day change of -0.23%. Ethereum displayed a marginally stronger performance, rising 0.54% in the last day to $2,125, though it continues to face significant monthly pressure with a 30-day decline of 7.78%. Both assets recorded below-average trading volumes relative to their 7-day averages, with BTC at 0.66x and ETH at 0.59x, indicating reduced market participation and a lack of conviction from traders. The Relative Strength Index (RSI) readings are notably low, with BTC at 36.2 and ETH at 31.0, both in oversold territory, suggesting that selling pressure may be exhausting, though no immediate reversal is confirmed. The overall market tone remains cautious as prices consolidate near key moving averages.
Bitcoin Analysis
TradingView Live (4h)
Bitcoin’s price action on May 26 reflects a continuation of the consolidation phase that has characterized the past several weeks. The daily close at $77,194 places BTC just above its 7-day moving average (MA7) of $77,006, a positive but fragile technical position. However, the asset remains below its 30-day moving average (MA30) of $78,563, indicating that the short-term trend is still bearish relative to the broader monthly view. The gap between the MA7 and MA30—approximately $1,557—suggests that momentum has been insufficient to reclaim higher levels, and BTC is currently trapped between these two key averages.
The intraday range of $76,476 to $77,622 was relatively tight, with the session low testing the lower boundary of the recent 7-day range, which spans from $74,290 to $78,200. The 30-day range is wider, with a high of $82,850 and a low of $74,290, meaning BTC is trading in the lower half of its monthly range. This positioning indicates that bears have maintained control since the $82,850 peak, and buyers have not been able to push prices back toward that level.
Volume is a critical concern. The current volume is 0.66x the 7-day average, reflecting a significant drop in trading activity. Low volume during consolidation often precedes a breakout, but without a catalyst, the direction remains uncertain. The RSI(14) at 36.2 is deep in oversold territory (below 30 is typically considered extreme oversold, but below 40 is often seen as bearish). This reading suggests that selling pressure may be overdone, and a technical bounce could materialize if buyers step in. However, oversold conditions can persist in downtrends, so this signal alone is not a buy indicator.
Key support levels to monitor include the recent 7-day low of $74,290 and the psychological $75,000 mark. On the upside, resistance is first encountered at the MA30 of $78,563, followed by the 7-day high of $78,200 and then the 30-day high of $82,850. The lack of volume and the oversold RSI create a scenario where a low-volatility grind or a sudden spike is possible, but the current data favors a neutral-to-slightly-bearish bias in the short term. Traders should watch for a volume expansion to confirm any directional move.
Ethereum Analysis
TradingView Live (4h)
Ethereum’s price action on May 26 shows a slight outperformance versus Bitcoin in the daily session, with a 0.54% gain to $2,125. The intraday high of $2,137 and low of $2,085 indicate a narrow trading range, similar to BTC. ETH is trading above its 7-day moving average of $2,112, a modestly positive signal, but remains well below its 30-day moving average of $2,237, reinforcing the bearish monthly trend. The MA7-MA30 spread of $125 is narrower than BTC’s in percentage terms, but the monthly decline of 7.78% is significantly deeper than BTC’s near-flat performance.
The 7-day range for ETH spans from $2,009 to $2,158, and the current price is near the upper end of this range, suggesting that short-term momentum is slightly favorable. The 30-day range, however, is much wider, with a high of $2,424 and a low of $2,009. ETH is trading in the lower third of this monthly range, indicating that the asset has been under persistent selling pressure since the $2,424 peak. The fact that ETH has not revisited its monthly low of $2,009 in the past week is a minor positive, but the overall structure remains weak.
Volume is even more subdued for ETH than BTC, at 0.59x the 7-day average. This below-average participation suggests that the recent bounce from the $2,009 low is not accompanied by strong conviction. The RSI(14) at 31.0 is in oversold territory, approaching the extreme oversold threshold of 30. This is a more pronounced oversold reading than BTC’s, which could imply that ETH is closer to a potential reversal, but it also reflects the deeper monthly decline.
Key technical levels for ETH are clear. Support is at the 7-day low of $2,009, which also serves as the 30-day low. A break below this level would open the door to further downside, potentially toward the $1,900 psychological area. Resistance is at the 7-day high of $2,158, followed by the MA30 at $2,237 and then the 30-day high of $2,424. The oversold RSI and low volume create a setup where a short-term bounce is possible, but the monthly trend remains bearish. Without a volume catalyst, ETH may continue to drift sideways or lower.
Key Technical Levels
| Asset | Support | Resistance | RSI |
|---|---|---|---|
| BTC | $74,290 | $78,563 | Oversold (36.2) |
| ETH | $2,009 | $2,237 | Oversold (31.0) |
Both assets are in oversold territory based on the RSI(14), with ETH closer to the extreme oversold level. The support levels correspond to the 7-day lows (which are also the 30-day lows for ETH), while resistance levels are the 30-day moving averages, which represent the next significant technical barriers.
BTC vs ETH Dynamic
The correlation between Bitcoin and Ethereum remains high, as both assets are trading in similar patterns of low-volatility consolidation near their respective moving averages. However, a subtle divergence is emerging: Bitcoin’s monthly performance is nearly flat (-0.23%), while Ethereum’s 30-day decline of 7.78% is significantly worse. This suggests that ETH is underperforming BTC on a relative basis, which is a common pattern during risk-off periods in the crypto market. The daily performance is mixed, with ETH posting a slight gain while BTC is marginally negative, but this is likely noise within the broader trend. The volume profiles are similar, with both assets seeing reduced activity, reinforcing the idea that the market is in a waiting pattern. If BTC can reclaim its MA30 and hold above $78,500, it may provide a catalyst for ETH to follow, but the current data does not support a clear leader.
Strategy Fit
Given the current market conditions—low volatility, oversold RSI readings, and reduced volume—a grid trading strategy is well-suited for the current environment. The narrow intraday ranges and lack of directional conviction mean that trend-following strategies are likely to generate whipsaw signals. A grid bot, such as those offered by Pionex, can capitalize on the small price fluctuations within the established support and resistance zones. For BTC, a grid range between $74,290 and $78,563 (the 7-day low and MA30 resistance) would capture the current consolidation zone. For ETH, a grid between $2,009 and $2,237 would align with the key support and resistance levels.
Dollar-cost averaging (DCA) is also a viable approach for longer-term accumulation, especially given the oversold RSI readings. However, the lack of a clear bottom confirmation means that DCA should be approached with caution, using smaller position sizes. Trend-following strategies are not recommended at this time due to the flat moving averages and low volume. Pionex’s built-in grid and DCA bots can automate these strategies, allowing traders to participate without constant monitoring. The low volume environment also favors using a tight grid spacing to capture small profits, as wide ranges may not trigger frequently.
Risk Disclaimer
This market recap is for informational and educational purposes only and does not constitute financial advice, investment recommendation, or solicitation to buy or sell any digital assets. Cryptocurrency markets are highly volatile and involve substantial risk of loss. Past performance is not indicative of future results. All trading decisions should be made based on your own research and risk tolerance. You should consult with a qualified financial advisor before making any investment decisions. The author and Pionex are not responsible for any losses incurred from trading activities.
FAQ
Q: What does the RSI reading of 36.2 for Bitcoin mean?
A: The RSI (Relative Strength Index) of 36.2 indicates that Bitcoin is in oversold territory. This suggests that selling pressure has been dominant and the asset may be undervalued in the short term. However, oversold conditions can persist, and this signal alone does not guarantee a price reversal. It is often used in conjunction with other indicators.
Q: Why is Ethereum’s 30-day performance worse than Bitcoin’s?
A: Ethereum has experienced a 7.78% decline over the past 30 days, compared to Bitcoin’s near-flat performance. This underperformance is typical during risk-off periods, as Ethereum is considered a higher-beta asset and often sees larger percentage moves than Bitcoin. Factors such as lower liquidity and different market narratives can also contribute.
Q: What is the significance of the 7-day moving average in the analysis?
A: The 7-day moving average (MA7) is a short-term trend indicator. When the price is above the MA7, it suggests short-term bullish momentum; when below, it indicates bearish momentum. Currently, both BTC and ETH are trading near their MA7, reflecting a neutral short-term trend.
Q: How does low volume affect the market?
A: Low volume, as seen with BTC at 0.66x and ETH at 0.59x of their 7-day averages, indicates reduced market participation. This can lead to choppy price action and false breakouts, as fewer trades are needed to move prices. Low volume often precedes a period of consolidation or a sharp move when volume returns.
Q: What is a grid trading strategy, and why is it suitable now?
A: A grid trading strategy involves placing buy and sell orders at predetermined price intervals within a range. It profits from small price fluctuations. It is suitable in low-volatility, range-bound markets like the current one, where prices oscillate between support and resistance without a clear trend. Pionex offers automated grid bots for this purpose.