BTC ETH Daily Recap — June 19, 2026

BTC ETH Daily Recap — June 19, 2026
Today at a Glance
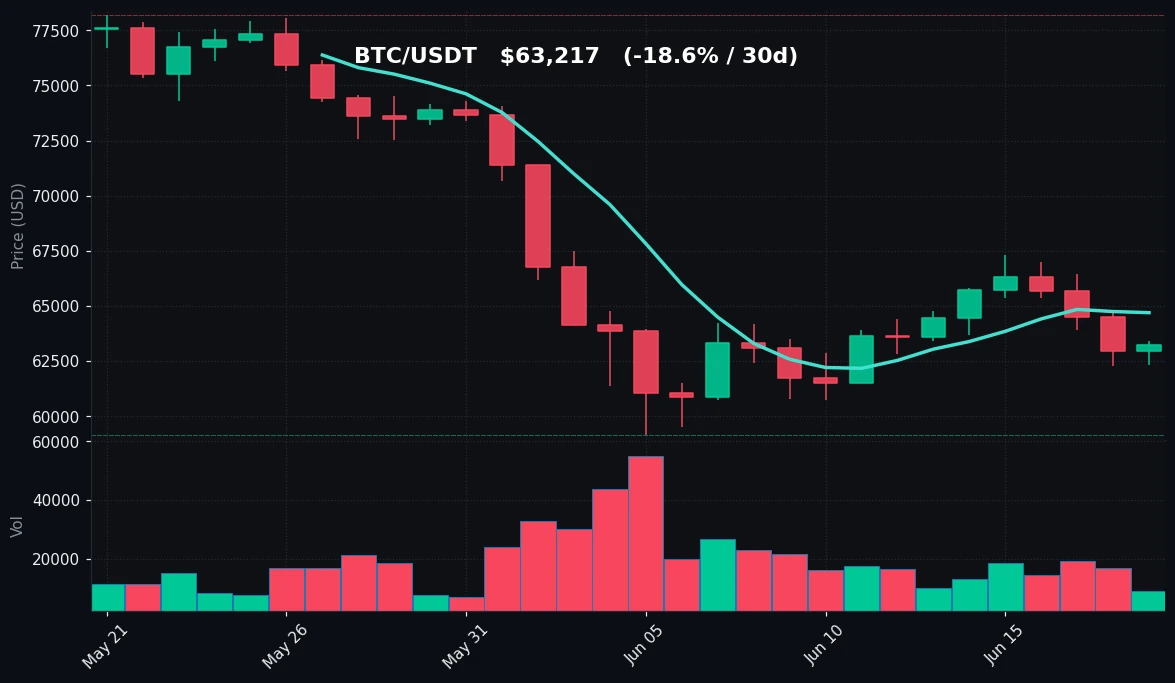
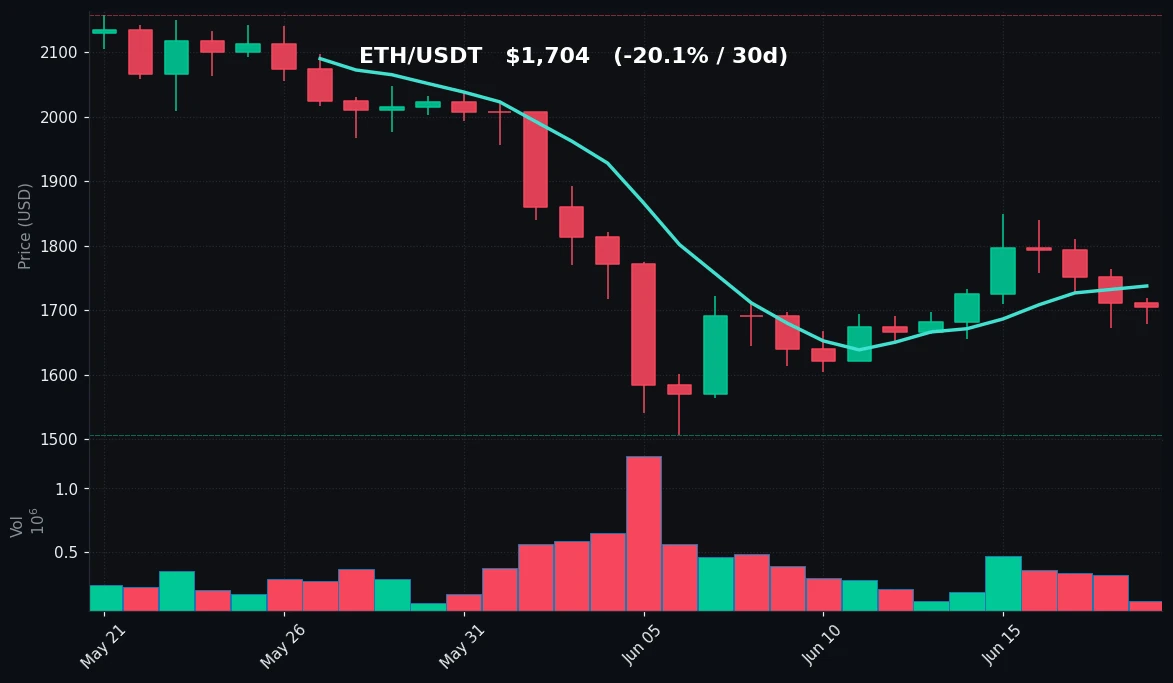
The crypto market on June 19, 2026, showed mixed signals as Bitcoin (BTC) posted a modest 24-hour gain of +0.41%, trading at $63,217, while Ethereum (ETH) edged lower by -0.41% to $1,704. BTC’s intraday range spanned $62,316 to $63,415, with price action holding above the monthly low of $59,131 but well below the 30-day high of $78,200. ETH, meanwhile, recovered 2.26% over the past week, though its 30-day decline of -20.14% underscores sustained bearish pressure. Trading volumes for both assets remain subdued—BTC at 0.58x its 7-day average and ETH at 0.4x—suggesting cautious participation. The Relative Strength Index (RSI) for BTC sits at 58.3, neutral but leaning bullish, while ETH’s RSI of 62.5 indicates mild upward momentum. Key moving averages reveal BTC trading below its 7-day MA ($64,699) and 30-day MA ($68,240), while ETH is below its 7-day MA ($1,737) and 30-day MA ($1,848). Overall, the market is in a consolidation phase, with BTC attempting to stabilize after a steep monthly correction and ETH showing relative weekly strength.
Bitcoin Analysis
TradingView Live (4h)
Bitcoin’s price action on June 19 reflects a market in technical repair following a brutal 30-day decline of -18.55%. The current price of $63,217 sits above the 30-day low of $59,131 but remains significantly below the 30-day high of $78,200, highlighting a -19.2% drop from peak to current levels. The 7-day trend shows a slight erosion of -0.57%, with the 7-day high of $67,292 and low of $62,272 framing a narrowing range. This contraction suggests decreasing volatility and potential accumulation near support.
Key technical levels: The 7-day moving average at $64,699 acts as immediate resistance, while the 30-day MA at $68,240 represents a stronger overhead barrier. On the downside, the $62,272 level (7-day low) and $59,131 (30-day low) provide critical support. The RSI(14) at 58.3 sits in neutral territory, not yet overbought (above 70) or oversold (below 30), indicating room for either direction. Volume at 0.58x the 7-day average points to diminished trader interest, often a precursor to a breakout or breakdown.
The daily chart shows BTC forming a series of higher lows since the $59,131 trough on May 20, but the inability to reclaim the 7-day MA suggests sellers remain active near $64,700. The 30-day MA sloping downward reinforces the bearish medium-term structure. Without a volume catalyst, BTC may continue to oscillate between $62,000 and $64,500. The lack of overbought RSI readings leaves the door open for a potential move toward resistance, but the low volume environment favors range-bound behavior. Traders should monitor a close above $64,700 to signal short-term bullish momentum, while a break below $62,000 could re-test the $59,000 zone.
Ethereum Analysis
TradingView Live (4h)
Ethereum’s price of $1,704 on June 19 shows a modest 24-hour decline of -0.41%, contrasting with BTC’s slight gain. However, the 7-day performance of +2.26% indicates relative strength compared to BTC’s -0.57% over the same period. This divergence suggests ETH may be attracting buyers after its steeper 30-day decline of -20.14%, which saw prices fall from a 30-day high of $2,158 to a low of $1,506—a -30.2% correction.
Technical levels: The 7-day MA at $1,737 and 30-day MA at $1,848 both sit above current price, acting as resistance. The 7-day high of $1,850 and low of $1,655 define the recent trading range. The RSI(14) at 62.5 is in bullish territory but not overbought, suggesting upward momentum could continue if volume supports it. Volume at 0.4x the 7-day average is notably low, indicating hesitation among traders.
The daily chart reveals ETH has bounced sharply from the $1,506 low, recovering over 13% to current levels. The 7-day trend shows higher lows and higher highs, a constructive pattern. However, the 30-day MA continues to slope downward, capping upside potential. The $1,737 level (7-day MA) is the first test; a daily close above this could target the $1,850 area (7-day high). Support sits at $1,655 (7-day low) and $1,506 (30-day low). The RSI near 62.5 suggests the rally has room to extend before reaching overbought conditions above 70. Yet, the low volume raises questions about sustainability. ETH’s correlation with BTC remains high, but its relative weekly strength may signal a shift in capital flows. If ETH can break above $1,737 on rising volume, it could lead a broader altcoin recovery. Conversely, a drop below $1,655 would negate the short-term bullish structure.
Key Technical Levels
| Asset | Support | Resistance | RSI |
|---|---|---|---|
| BTC | $62,272 / $59,131 | $64,699 / $68,240 | 58.3 (neutral) |
| ETH | $1,655 / $1,506 | $1,737 / $1,850 | 62.5 (neutral-bullish) |
BTC vs ETH Dynamic
The correlation between Bitcoin and Ethereum remains high, as both assets experienced similar 30-day drawdowns (-18.55% for BTC vs -20.14% for ETH). However, a notable divergence has emerged over the past week: ETH gained +2.26% while BTC slipped -0.57%. This suggests ETH is outperforming in the short term, possibly due to oversold conditions after its deeper correction. BTC’s dominance (often measured by market share) may be easing as traders rotate into ETH and altcoins. The volume disparity—BTC at 0.58x its average versus ETH at 0.4x—indicates BTC still attracts more relative activity, but ETH’s price action is showing greater resilience. Historically, when ETH leads BTC on a weekly basis, it can signal a shift toward risk-on sentiment in the broader market. However, given the low overall volume, this divergence should be watched for confirmation. A sustained move by ETH above its 7-day MA ($1,737) while BTC remains below its own 7-day MA ($64,699) would strengthen the case for ETH outperformance. Conversely, if BTC reclaims its 7-day MA first, it could pull ETH higher in tandem.
Strategy Fit
Based on current volatility and technical structure, a grid trading strategy is well-suited for the current environment. Both BTC and ETH are range-bound, with BTC oscillating between $62,000 and $64,500 and ETH between $1,655 and $1,737. Grid bots on Pionex can capitalize on these oscillations by placing buy orders near support and sell orders near resistance, profiting from small price movements. The low volume and neutral RSI readings support a mean-reversion approach rather than a trend-following one. For BTC, a grid range of $62,000 to $65,000 with 10-20 grids would capture the current volatility. For ETH, a range of $1,650 to $1,750 is appropriate. DCA (Dollar-Cost Averaging) strategies are also viable given the 30-day downtrend, allowing accumulation at lower prices. However, trend-following strategies (e.g., trailing stop or momentum bots) are less recommended due to the lack of clear directional momentum. Pionex’s built-in grid bots and DCA bots can automate these strategies, reducing emotional decision-making. Traders should set conservative grid widths and monitor for volume spikes that could break the range.
Risk Disclaimer
This report is for informational and educational purposes only and does not constitute financial advice, investment recommendation, or solicitation to trade. Cryptocurrency markets are highly volatile and involve substantial risk of loss. Past performance is not indicative of future results. You should consult with a qualified financial advisor before making any investment decisions. The author and Pionex assume no liability for any losses incurred from the use of this information.
FAQ
Q: Why did Bitcoin’s price rise slightly while Ethereum fell on June 19?
A: BTC gained +0.41% to $63,217, while ETH slipped -0.41% to $1,704. This divergence reflects short-term order flow and technical positioning. BTC bounced from its $62,316 intraday low, while ETH faced resistance near its 7-day MA at $1,737. Low volume (0.58x for BTC, 0.4x for ETH) suggests the moves are not trend-driven.
Q: What do the RSI values indicate for BTC and ETH?
A: BTC’s RSI(14) at 58.3 is neutral, meaning neither overbought nor oversold. ETH’s RSI at 62.5 is mildly bullish but below the 70 overbought threshold. Both suggest room for further movement without extreme conditions.
Q: Are the current low trading volumes a concern?
A: Yes, volume at 0.58x (BTC) and 0.4x (ETH) of their 7-day averages indicates reduced participation. Low volume can lead to false breakouts or increased sensitivity to news events. It often precedes periods of higher volatility.
Q: What are the key support levels to watch for BTC and ETH?
A: For BTC, immediate support is $62,272 (7-day low) and $59,131 (30-day low). For ETH, support is $1,655 (7-day low) and $1,506 (30-day low). A break below these levels could signal further downside.
Q: How can traders use Pionex bots in this market?
A: Grid trading bots are ideal for the current range-bound conditions, allowing traders to profit from price oscillations between support and resistance. DCA bots can accumulate positions during the 30-day downtrend. Pionex offers automated versions of both strategies.


