BTC ETH Daily Recap – July 3, 2026

BTC ETH Daily Recap – July 3, 2026
Today at a Glance
Bitcoin and Ethereum posted modest gains on July 3, 2026, with Bitcoin rising 0.65% to $61,958 and Ethereum advancing 2.49% to $1,743. Bitcoin’s intraday range was tight at $61,249–$62,282, reflecting low volatility relative to recent weeks. Ethereum outperformed, climbing 10.40% over the past seven days after bouncing from a local low of $1,548. BTC’s 30-day trend remains negative at -3.02%, while ETH’s 30-day performance is nearly flat at -1.57%. Trading volumes for both assets are below their 7-day averages—BTC at 0.47x and ETH at 0.54x—suggesting cautious participation. Bitcoin’s RSI of 44.0 remains in neutral territory, while Ethereum’s RSI of 53.1 indicates a slight bullish tilt. Key technical levels show BTC trading below its 30-day moving average ($62,443) but above the 7-day MA ($60,290). Ethereum has reclaimed both its 7-day ($1,626) and 30-day ($1,669) moving averages, signaling short-term strength.
Bitcoin Analysis
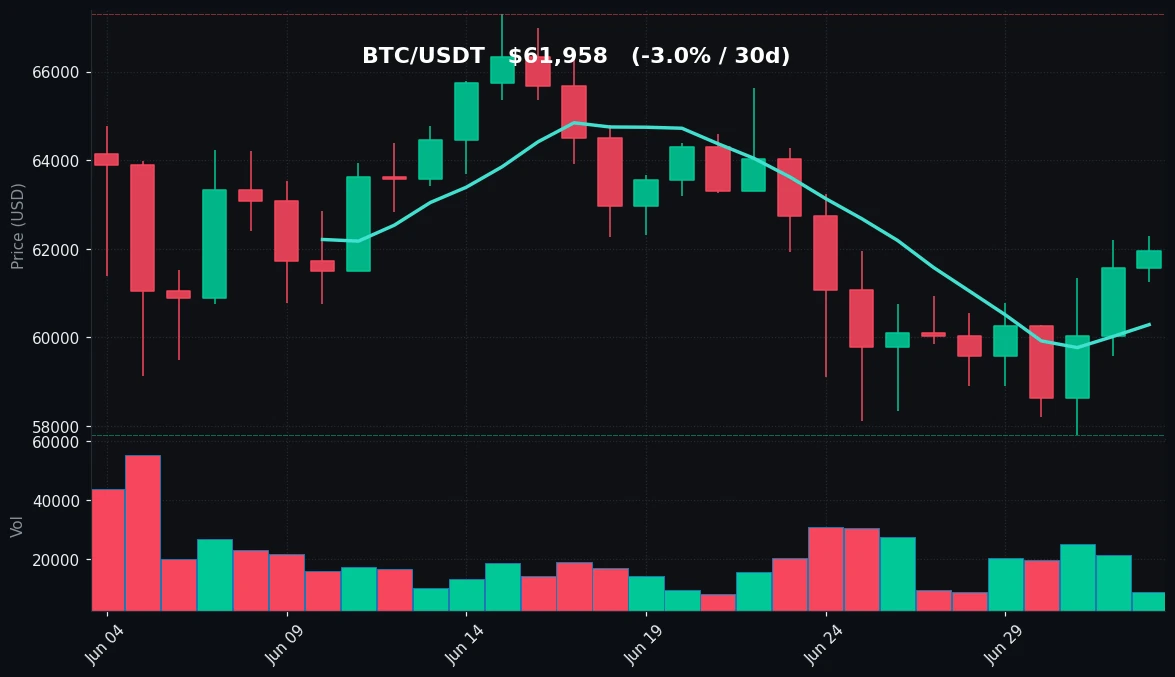
TradingView Live (4h)
Bitcoin is currently trading at $61,958, up 0.65% in the last 24 hours. The price action shows a narrow range between $61,249 and $62,282, with the high marking a 7-day peak. Over the past week, Bitcoin gained 3.10%, recovering from a 7-day low of $57,800. However, the 30-day trend remains bearish with a -3.02% decline, and the 30-day high of $67,292 is still 7.9% above current levels.
From a technical perspective, Bitcoin is positioned between its key moving averages. The 7-day MA at $60,290 serves as immediate support, while the 30-day MA at $62,443 acts as overhead resistance. The price has been unable to close decisively above the 30-day MA since late June, indicating persistent selling pressure near that level. The RSI(14) reads 44.0, which is neutral but leaning toward oversold territory—suggesting the asset is not yet overbought and may have room for further upside if momentum shifts.
Volume analysis reveals a significant drop in trading activity. Current volume is only 47% of the 7-day average, reflecting low participation. This reduced volume often precedes either a consolidation phase or a potential breakout, as traders await clearer directional cues. The 24-hour high of $62,282 aligns closely with the 30-day MA, making this a critical resistance zone. A break above $62,443 with volume would signal a potential trend reversal, while a failure to hold above $60,290 could lead to a retest of the $57,800 support.
Bitcoin’s price structure remains range-bound between $57,800 and $62,443. The lack of strong directional momentum suggests traders are adopting a wait-and-see approach, possibly ahead of macroeconomic data or market events. The neutral RSI and below-average volume support a consolidation narrative rather than an imminent breakout.
Ethereum Analysis
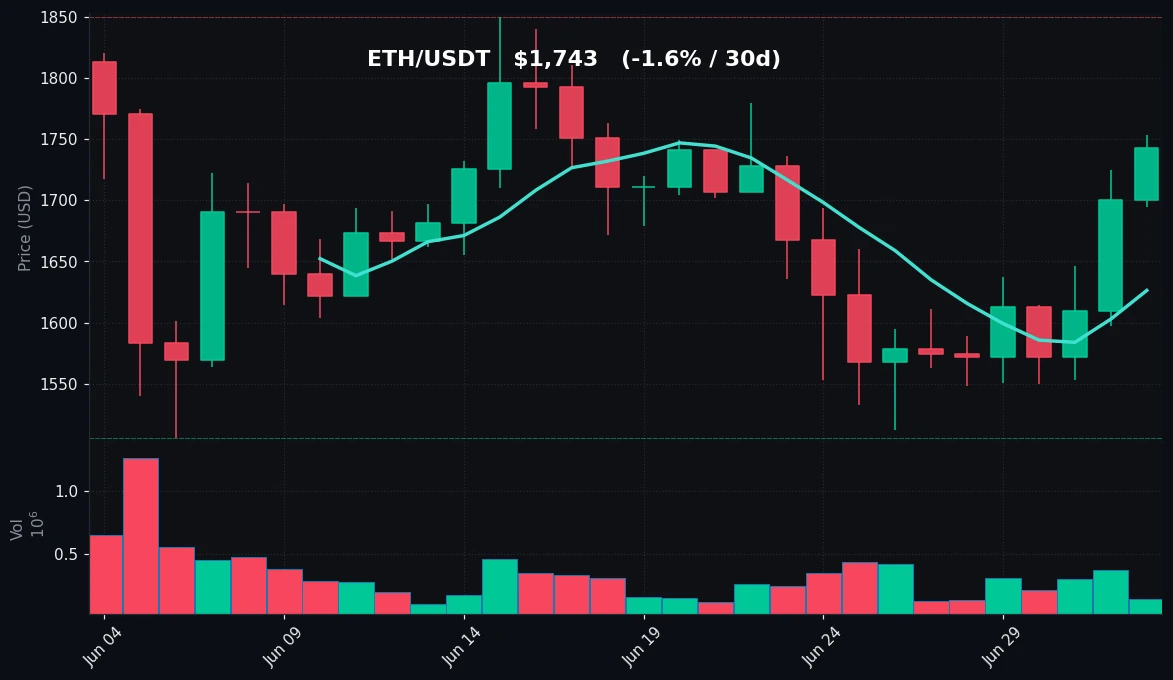
TradingView Live (4h)
Ethereum is trading at $1,743, up 2.49% in the last 24 hours, with an intraday range of $1,695 to $1,753. The asset has been the stronger performer among the two, gaining 10.40% over the past seven days—significantly outpacing Bitcoin’s 3.10% weekly return. The 7-day low of $1,548 marks a clear bounce point, and the current price is 12.6% above that level.
Technically, Ethereum has reclaimed both its 7-day moving average ($1,626) and its 30-day moving average ($1,669). This is a bullish signal, as the price is now trading above both short-term trend lines. The 30-day MA at $1,669 now acts as immediate support, while the 30-day high of $1,850 serves as the next major resistance zone. The RSI(14) of 53.1 is neutral but slightly bullish, indicating that momentum is tilting upward without being overextended.
Volume for Ethereum is at 54% of its 7-day average, which, while still low, is slightly higher relative to Bitcoin. The reduced volume suggests that the recent rally may lack conviction, but the fact that Ethereum has broken above its 30-day MA on declining volume could indicate a slow accumulation phase. The 24-hour high of $1,753 is within striking distance of the psychological $1,800 level, which aligns with prior resistance in late June.
Ethereum’s 30-day performance of -1.57% is less severe than Bitcoin’s -3.02%, reinforcing its relative strength. The asset’s ability to hold above $1,669 will be crucial in the coming sessions. A sustained move above $1,753 could open the path toward $1,800 and eventually the 30-day high of $1,850. Conversely, a drop below $1,669 would negate the short-term bullish setup and potentially lead to a retest of $1,548.
Key Technical Levels
| Asset | Support | Resistance | RSI |
|---|---|---|---|
| BTC | $60,290 / $57,800 | $62,443 / $62,282 | neutral (44.0) |
| ETH | $1,669 / $1,548 | $1,753 / $1,850 | neutral-bullish (53.1) |
BTC vs ETH Dynamic
Bitcoin and Ethereum are exhibiting positive correlation today, with both assets posting gains. However, Ethereum’s 2.49% daily gain and 10.40% weekly gain significantly outpace Bitcoin’s 0.65% and 3.10% respectively, indicating a rotation toward altcoin strength. The ETH/BTC ratio has risen from approximately 0.0282 on June 26 to 0.0281 today, showing a slight relative outperformance by Ethereum. Bitcoin’s lower RSI (44.0 vs 53.1) and proximity to its 30-day MA suggest it may be lagging, while Ethereum’s break above both moving averages signals a more constructive short-term setup. The correlation between the two remains high, but the divergence in momentum favors Ethereum in the near term.
Strategy Fit
Given the current market conditions—low volume, neutral RSI readings, and price action near key moving averages—a range-bound or consolidation strategy is most appropriate. Bitcoin is trading between $57,800 and $62,443, while Ethereum is between $1,548 and $1,850. These well-defined ranges make grid trading a suitable approach. A grid bot can profit from the price oscillations within these zones without requiring directional conviction. For Bitcoin, a grid set between $57,800 and $62,443 with 10–15 grids would capture the current volatility. For Ethereum, a grid between $1,548 and $1,850 with a similar number of grids aligns with the broader range.
Alternatively, DCA (Dollar-Cost Averaging) can be used for long-term accumulation, especially given the neutral RSI and below-average volume. DCA reduces timing risk and works well in low-volatility environments. For traders seeking a trend-following approach, a trend-trading bot could be activated if Bitcoin breaks above $62,443 with volume, or if Ethereum clears $1,753 convincingly. Pionex offers built-in grid trading, DCA bots, and trend-following strategies that can be easily configured to match these levels. The current environment favors patience and range-bound strategies over aggressive directional bets.
Risk Disclaimer
This market recap is for informational and educational purposes only. It does not constitute financial advice, investment recommendations, or solicitation to buy or sell any assets. Cryptocurrency markets are highly volatile and involve substantial risk. Past performance is not indicative of future results. Always conduct your own research and consult with a qualified financial advisor before making any investment decisions.
FAQ
What is the current price of Bitcoin on July 3, 2026?
Bitcoin is trading at $61,958, up 0.65% in the last 24 hours.
What is the current price of Ethereum on July 3, 2026?
Ethereum is trading at $1,743, up 2.49% in the last 24 hours.
Why is Ethereum outperforming Bitcoin today?
Ethereum has gained 10.40% over the past seven days compared to Bitcoin’s 3.10%, and its RSI of 53.1 is slightly bullish versus Bitcoin’s 44.0. Ethereum has also reclaimed both its 7-day and 30-day moving averages, signaling short-term strength.
What are the key support and resistance levels for Bitcoin?
Support levels are $60,290 (7-day MA) and $57,800 (7-day low). Resistance levels are $62,443 (30-day MA) and $62,282 (24-hour high).
What trading strategy is recommended for current market conditions?
Given low volume and neutral RSI readings, grid trading within established ranges ($57,800–$62,443 for Bitcoin, $1,548–$1,850 for Ethereum) is suitable. DCA is also appropriate for long-term accumulation. Pionex offers built-in bots for these strategies.


