BTC ETH Daily Recap – June 20, 2026
BTC ETH Daily Recap – June 20, 2026
Today at a Glance
On June 20, 2026, Bitcoin and Ethereum traded in a narrow range, reflecting a market in consolidation mode. Bitcoin edged down 0.28% to $63,368, with a 24-hour range between $63,278 and $63,907, as trading volume slumped to just 34% of its 7-day average. The asset remains 16.11% lower over the past 30 days, struggling to recover from a sharp sell-off earlier in the month. Ethereum posted a minor gain of 0.30% to $1,716, outperforming BTC on the day, with a 24-hour high of $1,734 and low of $1,704. ETH’s 7-day performance turned positive at +2.09%, though its 30-day decline of 16.92% mirrors Bitcoin’s broader bearish trend. Both assets show reduced volatility and low volume, suggesting traders are awaiting a catalyst. RSI readings—59.3 for BTC and 65.7 for ETH—indicate neutral to slightly bullish momentum, but the lack of participation raises caution. The market appears to be in a wait-and-see phase, with both coins trading below their key moving averages.
Bitcoin Analysis
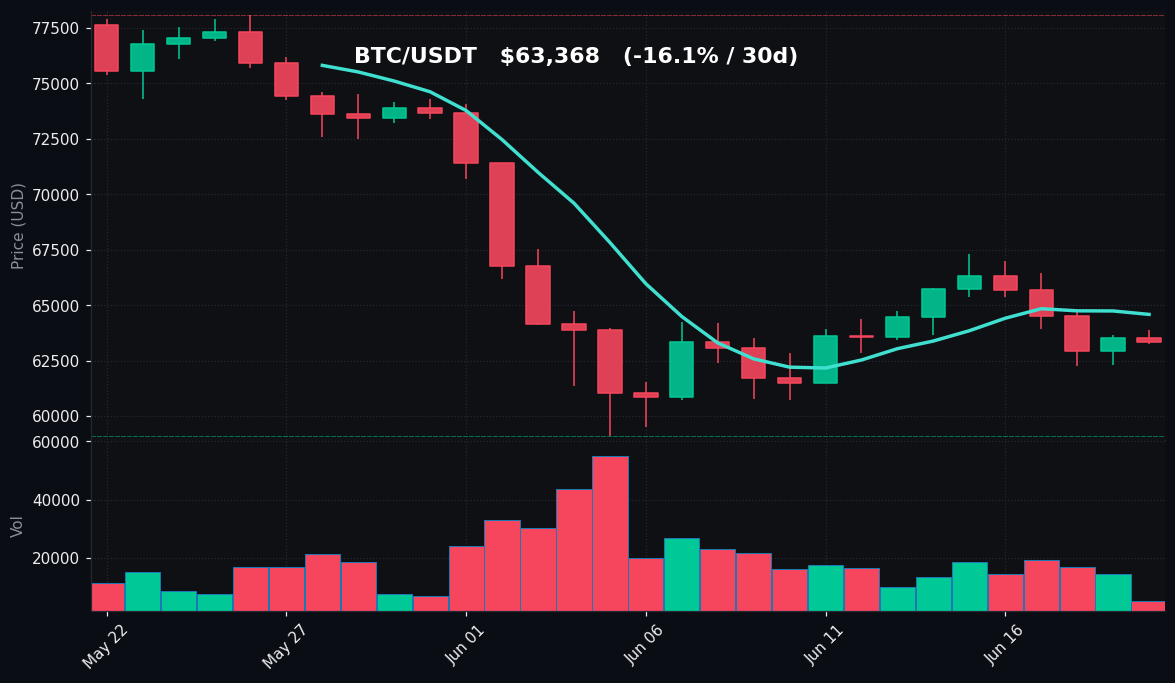
TradingView Live (4h)
Bitcoin’s price action on June 20 reflects a market in a holding pattern. The asset closed at $63,368, down 0.28% in the last 24 hours, with a tight intraday range of just $629—from $63,278 to $63,907. This low volatility comes after a week of modest losses (-1.69%) and a more pronounced 30-day decline of 16.11%. The 7-day high of $67,292 and low of $62,272 illustrate a range-bound market, with Bitcoin unable to break above the $64,000 resistance zone despite brief attempts.
Technically, BTC is trading below its 7-day moving average (MA7) of $64,590 and its 30-day moving average (MA30) of $67,776. The MA30 slope remains downward, confirming a short-term bearish trend. The gap between price and MA30 is approximately $4,408, indicating that Bitcoin is still in a recovery phase from its 30-day low of $59,131. The RSI(14) at 59.3 sits in neutral territory, suggesting neither overbought nor oversold conditions, but the lack of momentum is evident.
Volume is a key concern: today’s volume is only 0.34x the 7-day average, the lowest reading in recent weeks. This indicates a lack of conviction among traders. Without volume, any breakout above $64,000 or breakdown below $63,000 may be short-lived. The $62,272 level from the 7-day low serves as immediate support, while resistance sits at $64,590 (MA7) and $67,292 (7-day high). A sustained move above $64,590 could signal a short-term reversal, but the low volume suggests the market is not ready for a decisive move.
Ethereum Analysis
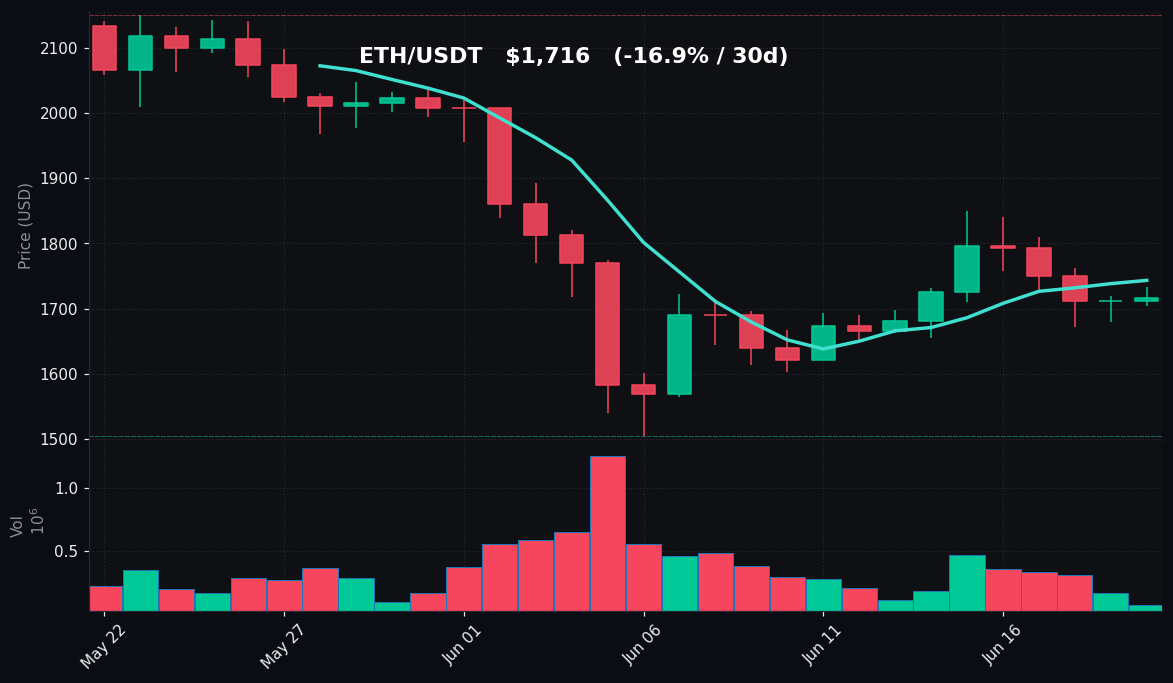
TradingView Live (4h)
Ethereum posted a modest 0.30% gain on June 20, closing at $1,716, with a 24-hour range of $1,704 to $1,734. This marks a slight outperformance versus Bitcoin, and ETH’s 7-day performance turned positive at +2.09%, recovering from a 30-day decline of 16.92%. The 7-day high of $1,850 and low of $1,655 highlight a volatile week, but today’s tight range suggests consolidation.
Technically, ETH is trading below its MA7 of $1,743 and MA30 of $1,834. The MA30 continues to slope downward, reinforcing the bearish medium-term trend. The price is $18 below the MA7 and $118 below the MA30, indicating that while ETH is attempting to recover, it has not yet reclaimed key moving averages. The RSI(14) at 65.7 is the highest among recent readings, approaching overbought territory but still neutral. This suggests some buying pressure, but not enough to confirm a trend reversal.
Volume is extremely low at 0.25x the 7-day average, even lower than Bitcoin’s. This indicates that the price move is not backed by strong participation. The $1,655 level from the 7-day low serves as critical support, while resistance is at $1,743 (MA7) and $1,850 (7-day high). A break above $1,743 could attract momentum traders, but the volume deficit makes any breakout suspect. The 30-day low of $1,506 remains a distant support, but today’s price action suggests ETH is holding above $1,700, which is a positive sign for bulls.
Key Technical Levels
| Asset | Support | Resistance | RSI |
|---|---|---|---|
| BTC | $62,272 | $64,590 | Neutral (59.3) |
| ETH | $1,655 | $1,743 | Neutral (65.7) |
Bitcoin’s immediate support is the 7-day low of $62,272, with a stronger floor at the 30-day low of $59,131. Resistance is at the MA7 of $64,590, followed by the 7-day high of $67,292. Ethereum’s support is at the 7-day low of $1,655, with a major floor at the 30-day low of $1,506. Resistance is at MA7 of $1,743 and the 7-day high of $1,850. Both assets have neutral RSI readings, with ETH slightly higher, indicating a potential for a short-term bounce but no clear directional bias.
BTC vs ETH Dynamic
Bitcoin and Ethereum are showing a moderate positive correlation today, with both assets moving in a narrow range. However, Ethereum’s 0.30% gain versus Bitcoin’s -0.28% loss indicates a slight divergence in short-term sentiment. Over the past 7 days, ETH has outperformed BTC by 3.78 percentage points (+2.09% vs -1.69%), suggesting capital rotation into Ethereum. This could be driven by expectations of ETH-specific catalysts, such as network upgrades or DeFi activity. However, the correlation remains intact on the 30-day timeframe, with both assets down approximately 16-17%. The ETH/BTC ratio has risen slightly, from 0.0270 to 0.0271, but remains near recent lows. Traders should monitor whether ETH can sustain its outperformance, which may signal a shift in market leadership.
Strategy Fit
Given the current low volatility and volume environment, a grid trading strategy is well-suited for both BTC and ETH. The tight ranges—BTC between $62,272 and $64,590, and ETH between $1,655 and $1,743—provide opportunities for grid bots to capture small price movements. Pionex’s built-in grid trading bot can automate buy-low and sell-high orders within these ranges, profiting from mean reversion without requiring directional bets. For more conservative traders, a DCA (Dollar Cost Averaging) strategy is appropriate, as the 30-day declines of 16%+ suggest assets are at discounted levels. DCA bots on Pionex can accumulate positions gradually, reducing timing risk. Trend-following strategies are not recommended today due to the lack of clear momentum and low volume. The RSI readings are neutral, so no overbought or oversold signals are present. Pionex’s infinity grid or margin grid bots could also be used for leveraged exposure, but caution is advised given the low volume. Overall, a range-bound approach is optimal until volume returns and a breakout direction is confirmed.
Risk Disclaimer
This market recap is for informational and educational purposes only and does not constitute financial advice, investment recommendations, or solicitation to buy or sell any digital assets. Cryptocurrency markets are highly volatile and involve substantial risk, including the potential loss of principal. Past performance is not indicative of future results. Technical analysis is subjective and may not predict market movements. Always conduct your own research and consult with a qualified financial advisor before making any investment decisions. The author and platform are not responsible for any losses incurred from trading activities.
FAQ
Q: Why is Bitcoin trading volume so low today?
A: Bitcoin’s volume is at 0.34x its 7-day average, indicating reduced trader participation. This often occurs during consolidation phases when the market lacks a clear catalyst. Low volume can lead to false breakouts or sudden volatility, so traders should be cautious.
Q: What does an RSI of 59.3 mean for Bitcoin?
A: An RSI of 59.3 is neutral, meaning Bitcoin is neither overbought (above 70) nor oversold (below 30). It suggests balanced buying and selling pressure, with no strong directional bias. This aligns with the current range-bound price action.
Q: Is Ethereum’s 7-day gain of +2.09% a sign of a trend reversal?
A: Not necessarily. While ETH has outperformed BTC in the past week, it remains 16.92% lower over 30 days and below its key moving averages. The 7-day gain could be a short-term bounce within a broader downtrend. Confirmation would require a break above $1,743 (MA7) on higher volume.
Q: What are the key support and resistance levels to watch for ETH?
A: Immediate support is at $1,655 (7-day low), with stronger support at $1,506 (30-day low). Resistance is at $1,743 (MA7) and $1,850 (7-day high). A close above $1,743 would be bullish, while a break below $1,655 could lead to a retest of the 30-day low.
Q: How can Pionex bots help in this market condition?
A: Pionex’s grid trading bot is ideal for range-bound markets like today’s, where BTC and ETH are trading within defined ranges. The bot automatically places buy and sell orders, capturing profits from small price fluctuations. For accumulation, the DCA bot can buy assets at regular intervals, reducing the impact of volatility.