BTC ETH Daily Recap – May 22, 2026
BTC ETH Daily Recap – May 22, 2026
Today at a Glance
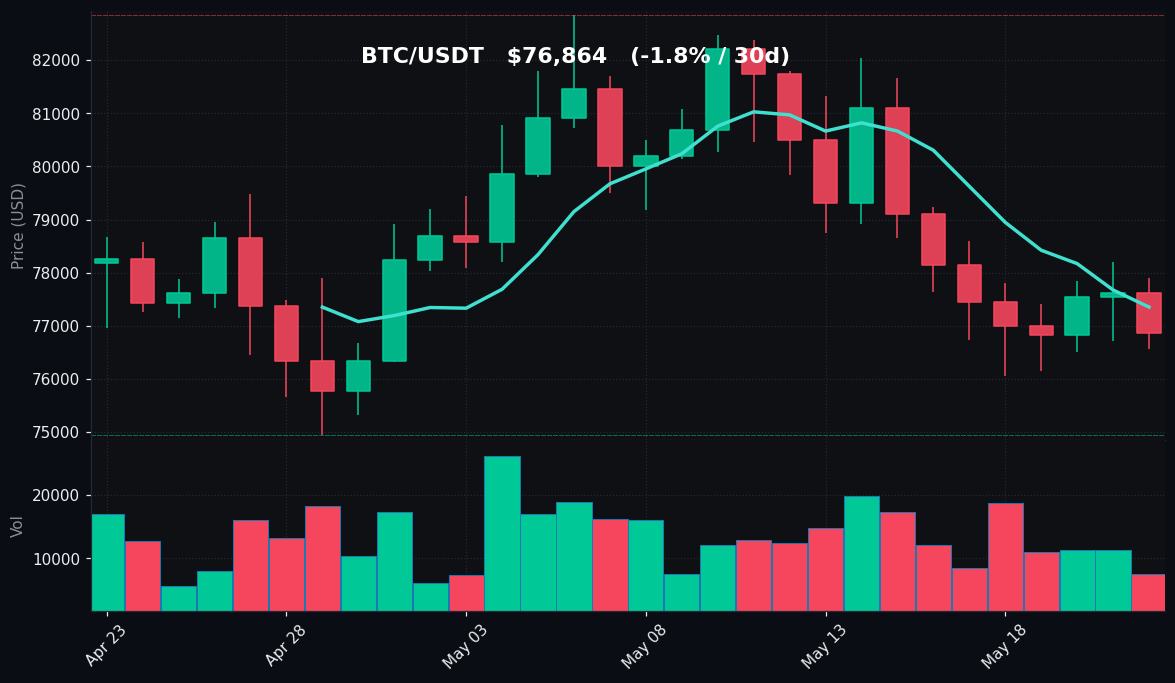
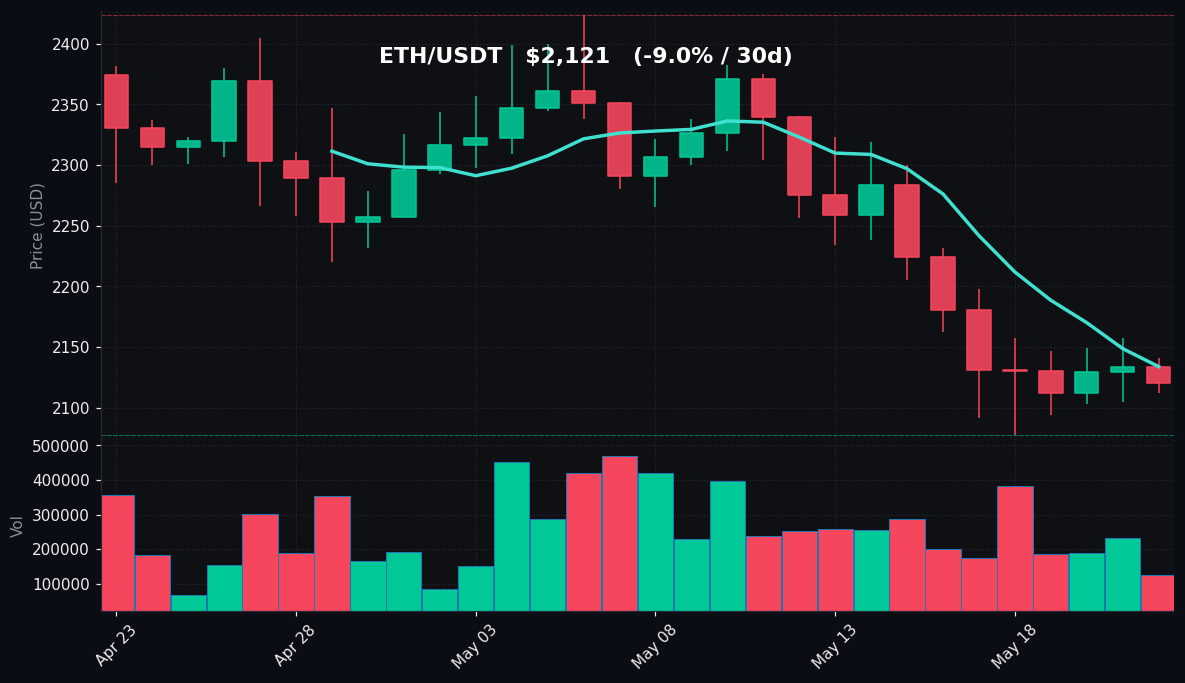
The cryptocurrency market experienced mild selling pressure on May 22, 2026, with both Bitcoin and Ethereum trading in the red over the past 24 hours. BTC/USDT slipped 0.97% to settle at $76,864, after touching an intraday high of $77,900 and a low of $76,570. The asset remains below its 7-day moving average ($77,353) and 30-day moving average ($78,728), signaling continued bearish momentum. Ethereum fell 0.61% to $2,121, with a 24-hour range of $2,112 to $2,141. ETH’s 7-day decline of 4.67% and 30-day drop of 8.99% highlight a deeper corrective phase compared to Bitcoin. Both assets saw significantly reduced trading volumes—BTC at 0.59x and ETH at 0.53x of their respective 7-day averages—suggesting a lack of conviction among market participants. The Relative Strength Index (RSI) for BTC sits at 36.7, approaching oversold territory, while ETH’s RSI of 27.1 is firmly in oversold conditions. The overall market tone remains cautious, with bears in control across short- and medium-term timeframes.
Bitcoin Analysis
TradingView Live (4h)
Bitcoin’s price action on May 22 reflects a continuation of the downtrend that has persisted over the past week and month. The asset opened near $77,600 and gradually declined to the $76,800 area, with intraday volatility contained within a $1,330 range. The inability to reclaim the $78,000 level—a key psychological and technical zone—underscores the current supply dominance. BTC is trading below both its 7-day moving average ($77,353) and 30-day moving average ($78,728), confirming a bearish short-term structure. The 7-day high of $79,228 and 30-day high of $82,850 now serve as distant resistance levels, while the 7-day low of $76,051 and 30-day low of $74,938 provide near-term support.
Volume analysis reveals a concerning picture: BTC’s 24-hour volume is only 0.59x its 7-day average, indicating thinning market participation. Low volume during a downtrend often suggests a lack of aggressive selling pressure, but it also means there is insufficient buying interest to stage a meaningful recovery. The RSI(14) at 36.7 is below the neutral 50 mark and approaching the oversold threshold of 30. Historically, such RSI levels have preceded short-term bounces, but the absence of volume confirmation makes a reversal uncertain. The MA7 ($77,353) is acting as immediate resistance, with a break above this level required for any bullish momentum. Below current price, the $76,000–$76,500 zone offers support, followed by the 30-day low at $74,938. Market participants should monitor whether BTC can hold above $76,000; a decisive breakdown below this level could accelerate selling toward the $74,000 area.
Ethereum Analysis
TradingView Live (4h)
Ethereum’s price action on May 22 paints a more pessimistic picture than Bitcoin. ETH declined 0.61% to $2,121, with a tight intraday range of just $29 between $2,112 and $2,141. The asset has now fallen 4.67% over the past week and 8.99% over the past month, underperforming BTC on both timeframes. ETH is trading well below its 7-day moving average ($2,134) and significantly below its 30-day moving average ($2,268), indicating a sustained bearish trend. The 7-day high of $2,232 and 30-day high of $2,424 are now distant resistance levels, while the 7-day and 30-day lows both sit at $2,077—a level that has been tested multiple times.
The technical indicators for ETH are flashing stronger bearish signals than BTC. The RSI(14) at 27.1 is firmly in oversold territory (below 30), suggesting that selling pressure has been intense and the asset may be due for a technical bounce. However, volume is a major concern: ETH’s 24-hour volume is only 0.53x its 7-day average, the lowest relative reading among major assets. Low volume during oversold conditions can lead to false signals, as a lack of buying interest may prevent a sustainable recovery. The MA7 ($2,134) is acting as immediate resistance, while the $2,077 support level (the 30-day low) is critical. A break below $2,077 could open the door to the $2,000 psychological level and lower. Conversely, a recovery above $2,134 would be the first sign of bullish reversal, but volume must confirm any such move.
Key Technical Levels
| Asset | Support | Resistance | RSI |
|---|---|---|---|
| BTC | $76,051 (7d low) / $74,938 (30d low) | $77,353 (MA7) / $78,728 (MA30) | 36.7 – approaching oversold |
| ETH | $2,077 (7d & 30d low) / $2,000 (psychological) | $2,134 (MA7) / $2,232 (7d high) | 27.1 – oversold |
BTC vs ETH Dynamic
The correlation between Bitcoin and Ethereum remains high, but the magnitude of the moves differs significantly. Over the past 30 days, BTC has declined 1.78%, while ETH has dropped 8.99%, making ETH nearly five times more volatile on the downside. This divergence suggests that capital is rotating out of altcoins and into Bitcoin as a relative safe haven within the crypto space. In the last 24 hours, both assets saw similar percentage declines (BTC -0.97%, ETH -0.61%), but ETH’s oversold RSI (27.1 vs BTC’s 36.7) indicates it is under more acute selling pressure. The volume ratios (0.59x for BTC, 0.53x for ETH) confirm that both markets are quiet, but ETH’s lower volume makes it more susceptible to sharp moves. Historically, when ETH underperforms BTC by this margin, it often signals a broader risk-off sentiment in the market. Traders should watch for a potential catch-up move if BTC stabilizes, but the current data favors BTC as the stronger relative performer.
Strategy Fit
Given the current market conditions—low volume, bearish trends, and oversold RSI readings—the most suitable strategies are conservative and mean-reversion oriented. Grid trading is particularly well-suited for this environment. With BTC and ETH trading in narrow ranges (BTC: $76,570–$77,900; ETH: $2,112–$2,141), a grid bot can profit from small price fluctuations without requiring a directional bias. Pionex’s Spot Grid Bot allows users to set buy and sell orders within a defined price range, automatically capturing profits from each oscillation. Given the low volume, a tight grid with narrow spreads (e.g., 0.3%–0.5% per level) is recommended to avoid overexposure.
Dollar-Cost Averaging (DCA) is another viable approach, especially for long-term holders. With BTC near $76,800 and ETH near $2,120, prices are below their 30-day moving averages, offering potential accumulation zones. Pionex’s DCA Bot automates periodic purchases, reducing the impact of short-term volatility. This strategy is ideal for investors who believe the current downtrend is temporary.
Trend-following strategies are not recommended at this time, as both assets lack clear directional momentum. The RSI oversold conditions could trigger a bounce, but low volume makes trend trades risky. Instead, consider using a Rebalancing Bot to maintain a target portfolio allocation between BTC and ETH, capitalizing on the relative strength of BTC versus ETH.
Risk Disclaimer
This market recap is for informational and educational purposes only and does not constitute financial advice, investment recommendation, or solicitation to buy or sell any digital assets. Cryptocurrency markets are highly volatile and involve substantial risk of loss. Past performance is not indicative of future results. Readers should conduct their own research and consult with a qualified financial advisor before making any investment decisions. The data presented is based on publicly available information as of May 22, 2026, and may contain errors or omissions. The author and Pionex assume no liability for any losses incurred from trading activities.
FAQ
Q: Why is Bitcoin’s RSI at 36.7 considered “approaching oversold” while Ethereum’s 27.1 is “oversold”?
A: The Relative Strength Index (RSI) is a momentum oscillator that measures the speed and change of price movements. A reading below 30 is conventionally considered oversold, indicating that the asset may be undervalued and due for a bounce. Bitcoin’s RSI of 36.7 is still above this threshold, suggesting selling pressure is strong but not yet extreme. Ethereum’s RSI of 27.1 is firmly in oversold territory, meaning it has experienced more intense and sustained selling relative to its recent price history.
Q: What does low trading volume (0.59x for BTC, 0.53x for ETH) mean for price action?
A: Low volume indicates reduced participation from buyers and sellers. In a downtrend, low volume can suggest that selling pressure is waning, potentially leading to a stabilization or bounce. However, it also means there is insufficient buying interest to sustain a rally. Low volume moves are often less reliable and can be subject to sudden reversals or fakeouts. Traders should wait for volume confirmation before entering positions.
Q: How can I use the support and resistance levels provided?
A: Support levels are price zones where buying interest is expected to emerge, potentially halting or reversing a decline. Resistance levels are zones where selling pressure is expected to cap further upside. For BTC, the key support is $76,051 (7-day low) and $74,938 (30-day low). Resistance is at $77,353 (MA7) and $78,728 (MA30). Traders can place limit orders near these levels or use them to set stop-losses and take-profits in grid or DCA strategies.
Q: Is this a good time to buy Ethereum given its oversold RSI?
A: An oversold RSI can indicate that an asset is undervalued and may rebound, but it is not a guaranteed buy signal. Ethereum’s low volume (0.53x average) and sustained downtrend (down 8.99% in 30 days) suggest that selling pressure could continue. A prudent approach would be to wait for a confirmed reversal—such as a break above the MA7 ($2,134) on increasing volume—before initiating long positions. Dollar-cost averaging can mitigate timing risk.
Q: What is the best Pionex bot for current market conditions?
A: Given the low volatility and range-bound trading, the Spot Grid Bot is the most suitable. It profits from small price fluctuations within a defined range. For BTC, a grid between $76,000 and $78,000 with 10–15 levels is reasonable. For ETH, a grid between $2,080 and $2,180 with similar parameters works. Alternatively, the DCA Bot is ideal for long-term accumulation, especially for investors who expect a recovery in the coming months.