BTC ETH Daily Recap – 2026-05-24
BTC ETH Daily Recap – 2026-05-24
Today at a Glance
As of May 24, 2026, Bitcoin and Ethereum continue to trade in a subdued environment, with both assets posting marginal losses over the past 24 hours. Bitcoin is currently at $76,735, down 0.02% on the day, while Ethereum trades at $2,109, down 0.40%. Over the past week, BTC has declined 0.93%, and ETH has fallen 1.03%. The 30-day performance shows a steeper decline for Ethereum, which is down 9.07%, compared to Bitcoin’s 1.15% drop. Trading volume remains significantly below the 7-day average for both assets: BTC volume is at 0.35x the average, and ETH at 0.4x, indicating reduced market participation. The Relative Strength Index (RSI) for both assets is in oversold territory, with BTC at 29.0 and ETH at 21.4, suggesting bearish momentum but potential for a technical bounce. Key support levels are being tested, with BTC’s 30-day low at $74,290 and ETH’s at $2,009.
Bitcoin Analysis
TradingView Live (4h)
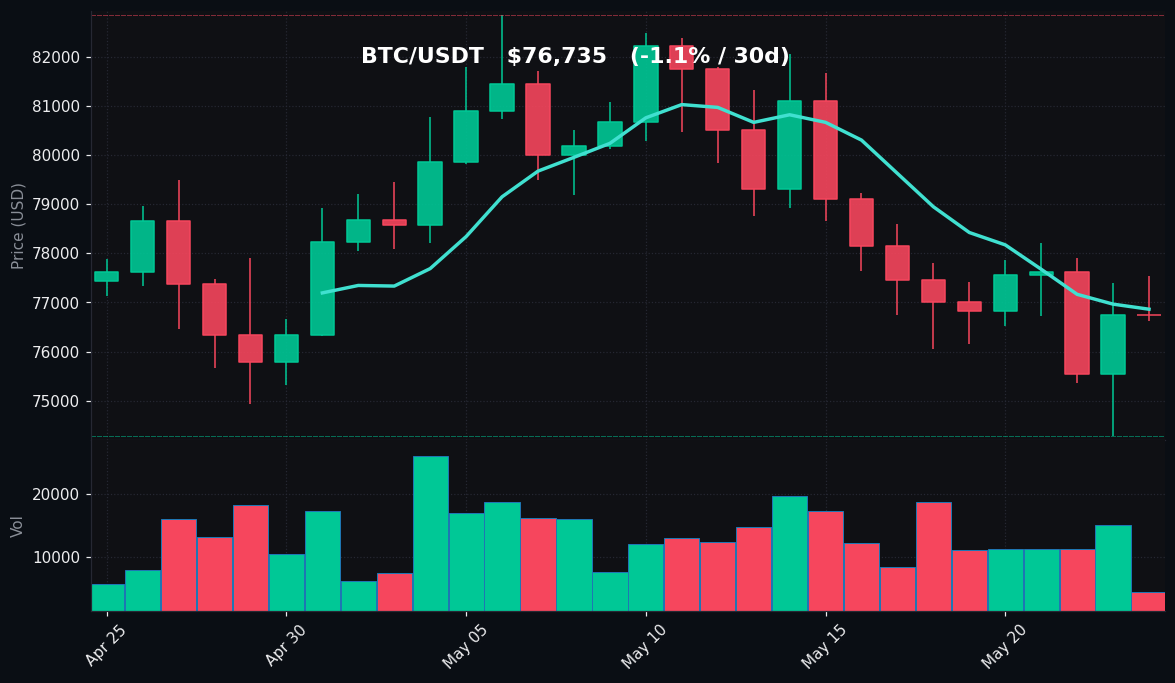
Bitcoin’s price action on May 24 reflects a market in consolidation, with the asset trading near the lower end of its recent range. The current price of $76,735 is below the 7-day moving average of $76,862 and significantly below the 30-day moving average of $78,610. This positioning indicates that short-term momentum is bearish, as BTC has failed to reclaim either moving average. The 24-hour high of $77,543 was met with selling pressure, and the low of $76,629 suggests that buyers are stepping in near the key psychological level of $76,500.
The 7-day range shows a high of $78,200 and a low of $74,290, with the current price closer to the middle of this band. The 30-day range is wider, from $82,850 down to $74,290, reinforcing that BTC has been in a downtrend over the past month. The RSI at 29.0 is in oversold territory, which historically can precede a short-term bounce, but the extremely low volume—0.35x the 7-day average—suggests that any recovery may be limited without a catalyst. The volume profile indicates a lack of conviction from both bulls and bears, with the market awaiting a trigger.
From a technical perspective, BTC is trading below both the 7-day and 30-day moving averages, which is a bearish signal. The 30-day MA at $78,610 now acts as a key resistance level, and a break above this would be needed to shift sentiment. On the downside, the 30-day low at $74,290 remains a critical support, and a break below could accelerate selling. The low volume environment suggests that the current price action may be driven by algorithmic trading and smaller retail participants, rather than institutional flows. The oversold RSI does not guarantee a reversal, but it does reduce the probability of further sharp declines without a fundamental change.
Ethereum Analysis
TradingView Live (4h)
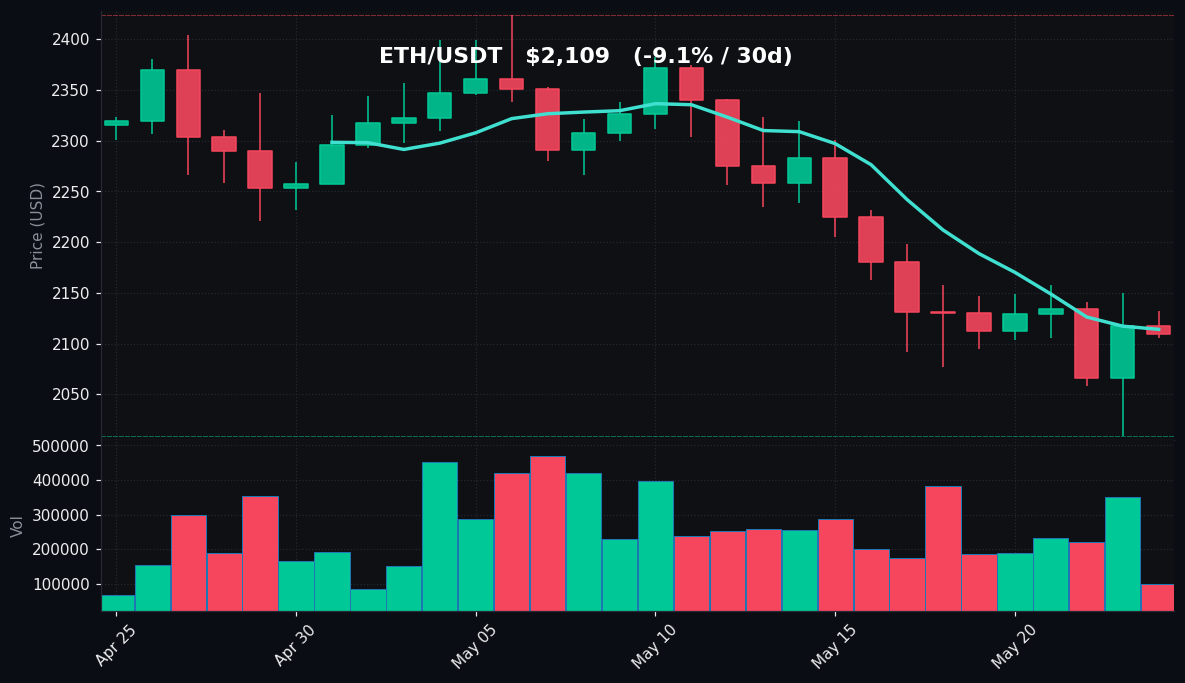
Ethereum is showing more pronounced weakness than Bitcoin, trading at $2,109 with a 24-hour decline of 0.40%. The asset is below both its 7-day moving average of $2,114 and its 30-day moving average of $2,252, indicating a bearish structure. The 24-hour range is narrow, with a high of $2,132 and a low of $2,106, suggesting low volatility and indecision. The 7-day range shows a high of $2,158 and a low of $2,009, with the current price near the lower end, reflecting persistent selling pressure.
The 30-day performance is particularly concerning for Ethereum, with a 9.07% decline compared to Bitcoin’s 1.15% drop. This underperformance is evident in the RSI, which at 21.4 is deeply oversold—lower than Bitcoin’s 29.0. The RSI at this level suggests that selling has been extreme, and a technical bounce is possible, but the low volume (0.4x the 7-day average) indicates that the market lacks the energy for a strong recovery. The 30-day high of $2,424 and low of $2,009 show a wide range, and the current price is closer to the low, confirming a downtrend.
Key technical levels for Ethereum are the 30-day moving average at $2,252, which now serves as resistance, and the 7-day moving average at $2,114, which is acting as immediate resistance. On the downside, the 30-day low at $2,009 is a critical support level. A break below $2,009 could trigger further selling, while a move above $2,252 would be needed to reverse the bearish trend. The volume data suggests that the market is waiting for a catalyst, and the oversold RSI may attract dip buyers, but the lack of volume makes any rally fragile. Ethereum’s correlation with Bitcoin remains high, but its steeper decline indicates that it is more sensitive to risk-off sentiment in the current environment.
Key Technical Levels
| Asset | Support | Resistance | RSI |
|---|---|---|---|
| BTC | $74,290 | $78,610 | Oversold (29.0) |
| ETH | $2,009 | $2,252 | Oversold (21.4) |
BTC vs ETH Dynamic
The correlation between Bitcoin and Ethereum remains strong, as evidenced by their similar intraday and weekly movements. Both assets are in oversold territory, with Ethereum showing a more extreme reading, which is typical during periods of risk aversion. However, the divergence in 30-day performance—BTC down 1.15% versus ETH down 9.07%—highlights Ethereum’s greater sensitivity to market stress. This dynamic suggests that while both assets are influenced by the same macro factors, Ethereum’s higher beta nature amplifies its moves. In the current low-volume environment, the correlation may persist, but any recovery is likely to see Ethereum outperform on a percentage basis due to its oversold condition. The ETH/BTC ratio has been declining, and a reversal in this ratio could signal a shift in market sentiment.
Strategy Fit
Given the current market conditions—low volume, oversold RSI on both assets, and prices below key moving averages—the environment is best suited for range-bound and mean-reversion strategies. Grid trading bots, such as those offered by Pionex, can capitalize on the tight 24-hour ranges by buying low and selling high within a predefined price band. For Bitcoin, a grid between $74,290 (support) and $78,610 (resistance) could be effective, while for Ethereum, a grid between $2,009 and $2,252 aligns with the current technical levels.
Dollar-cost averaging (DCA) is also appropriate for long-term holders, as the oversold RSI suggests that prices are below average valuations. A DCA bot can accumulate positions gradually, reducing the impact of short-term volatility. Trend-following strategies are not recommended due to the lack of clear directional momentum and low volume. The oversold conditions may lead to a bounce, but without volume confirmation, any trend is likely to be short-lived. Pionex’s built-in grid and DCA bots are well-suited for this low-volatility, range-bound market.
Risk Disclaimer
This market recap is for informational and educational purposes only and does not constitute financial advice, investment recommendations, or solicitation to buy or sell any assets. Cryptocurrency markets are highly volatile and involve substantial risk. Past performance and technical indicators are not guarantees of future results. You should conduct your own research and consult with a qualified financial advisor before making any investment decisions. The data provided is based on publicly available information and may not reflect real-time market conditions.
FAQ
What is causing the low volume in Bitcoin and Ethereum?
The low volume relative to the 7-day average (0.35x for BTC and 0.4x for ETH) suggests reduced market participation, which can be due to a lack of major news catalysts, institutional traders stepping back, or a wait-and-see approach ahead of key economic data. This often leads to tighter ranges and less conviction in price moves.
Why is Ethereum’s RSI more oversold than Bitcoin’s?
Ethereum’s RSI at 21.4 is more oversold than Bitcoin’s 29.0 because ETH has experienced a steeper 30-day decline (9.07% vs. 1.15%). This higher beta nature means that in risk-off environments, Ethereum tends to sell off more aggressively, pushing its RSI to more extreme levels.
What does an RSI below 30 mean for Bitcoin and Ethereum?
An RSI below 30 is typically considered oversold, indicating that the asset may be undervalued in the short term and could be due for a bounce. However, in a low-volume environment, oversold conditions can persist, and a reversal is not guaranteed without a catalyst or increased buying pressure.
Are the moving averages signaling a bearish trend?
Yes, both Bitcoin and Ethereum are trading below their 7-day and 30-day moving averages, which is a bearish signal. This positioning indicates that short-term and medium-term momentum is negative. For a trend reversal, prices would need to reclaim these moving averages, particularly the 30-day MA.
What strategies are best for this market environment?
Given the low volume and oversold conditions, grid trading and DCA are the most suitable strategies. Grid bots can profit from the tight ranges, while DCA allows for accumulation at lower prices. Trend-following strategies are less effective due to the lack of clear directional movement. Pionex offers both grid and DCA bots that can be automated for these conditions.