BTC ETH Daily Recap | July 1, 2026 – Bears Tighten Grip as Momentum Fades

BTC ETH Daily Recap | July 1, 2026 – Bears Tighten Grip as Momentum Fades
Today at a Glance
The crypto market opened July with a cautious tone as both Bitcoin and Ethereum attempted to recover from recent losses. BTC/USDT traded at $59,308, up 1.17% in the last 24 hours, recovering from a 24-hour low of $57,800 but still well below its 30-day high of $71,409. Ethereum mirrored the move, rising 1.28% to $1,592, though it remains 14.40% lower over the past month. Despite the daily gains, both assets face persistent selling pressure: BTC’s RSI sits at 29.4 (oversold territory) and ETH’s at 30.4, signaling exhaustion but no clear reversal. Volume remains low—BTC at 0.62x its 7-day average and ETH at just 0.5x—indicating a lack of conviction among buyers. The week’s performance remains negative, with BTC down 2.90% and ETH down 1.86% in the last seven days. The market appears to be consolidating near recent lows, with key support levels being tested. The 30-day moving averages ($62,665 for BTC, $1,676 for ETH) remain overhead resistance, suggesting that any sustained upside will require a significant catalyst or a shift in broader risk appetite.
Bitcoin Analysis
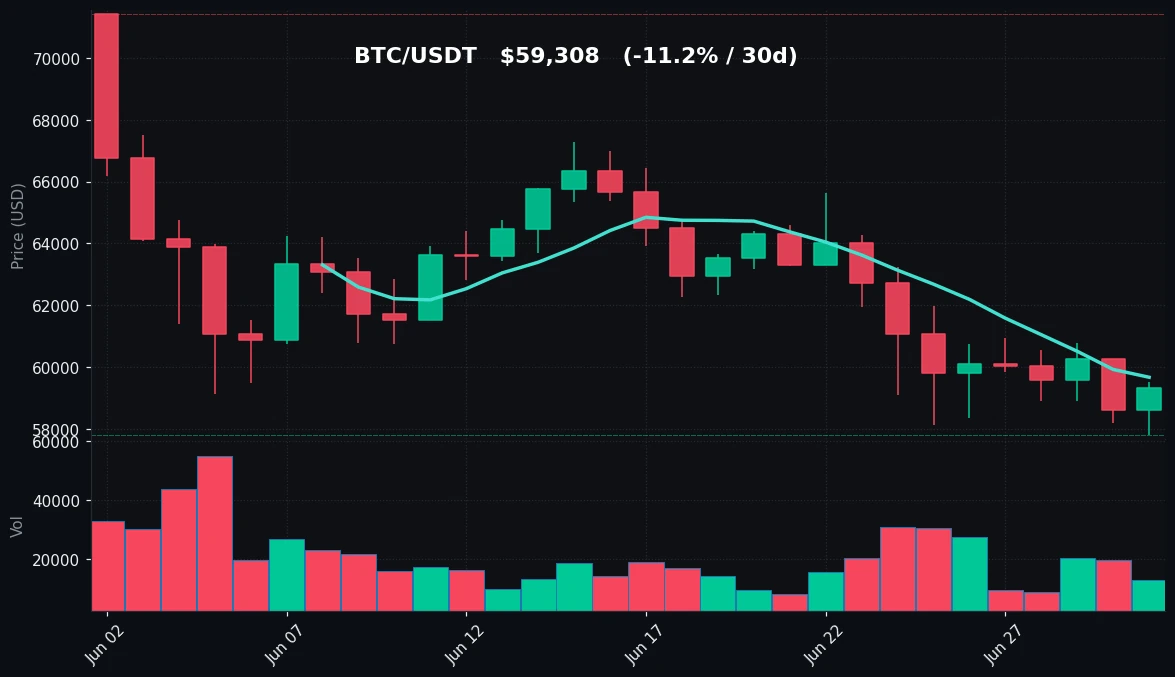
TradingView Live (4h)
Bitcoin’s price action on July 1 shows a modest intraday recovery from the $57,800 low, but the broader trend remains bearish. The asset is trading below both its 7-day moving average ($59,670) and its 30-day moving average ($62,665), a classic sign of short-term and medium-term weakness. The 7-day high of $61,962 from earlier this week now serves as immediate resistance, while the $57,800 level has become a critical support—matching the 30-day low. A break below this level could open the door to further declines, potentially toward the $55,000 psychological zone.
Volume analysis reveals a concerning lack of participation. With volume at just 0.62x the 7-day average, the bounce from $57,800 appears driven by low liquidity rather than genuine buying interest. This pattern often precedes either a continuation of the downtrend or a sharp but short-lived squeeze if sellers step away. The RSI at 29.4 is firmly in oversold territory (below 30), which historically has preceded short-term bounces, but the indicator has remained below 40 for several days, reflecting sustained bearish momentum.
Key technical levels to watch: immediate resistance at $59,670 (MA7), followed by $61,962 (7-day high) and $62,665 (MA30). On the downside, support at $57,800 (30-day low) is the first line of defense, with a break exposing $55,000 and then $52,000. The daily chart shows lower highs since the $71,409 peak on June 1, and the lack of a clear reversal pattern suggests that sellers remain in control. Traders should note that oversold conditions can persist in strong trends, and a move above MA7 would be the first sign of stabilization.
Ethereum Analysis
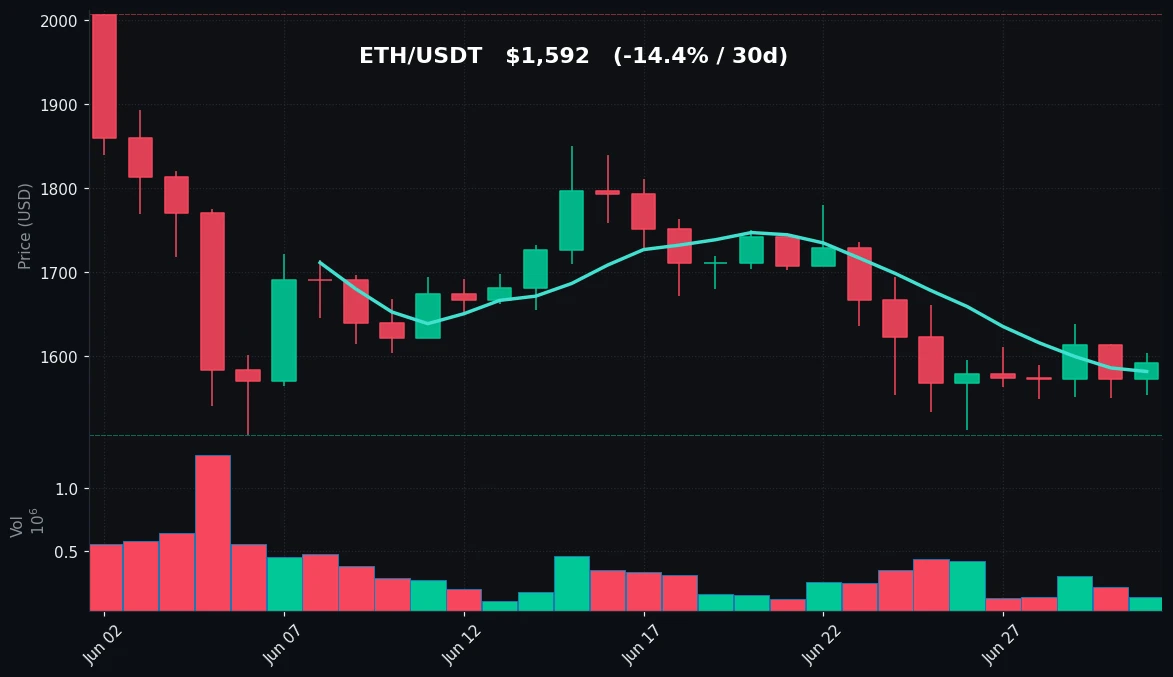
TradingView Live (4h)
Ethereum’s technical picture closely mirrors Bitcoin’s but with even weaker relative strength. At $1,592, ETH is trading just above its 7-day moving average of $1,581 but well below its 30-day moving average of $1,676. The 24-hour range ($1,553–$1,604) shows a tight intraday band, reflecting indecision. The 7-day low of $1,512 remains a critical support, while the 30-day high of $2,007 is now a distant memory, representing a 20.7% decline from peak to current levels.
Volume is the most bearish signal for Ethereum. At 0.5x the 7-day average, today’s trading activity is half of what is typical, suggesting that even the modest 1.28% gain lacks conviction. Low volume bounces in downtrends are often short-lived and can be reversed quickly. The RSI at 30.4 is just above oversold territory (below 30), but like BTC, it has been trending lower for weeks. The last time ETH’s RSI was this low was during the June 2025 correction, which eventually led to a 15% bounce over two weeks.
Resistance levels are stacked above: $1,604 (24-hour high), $1,661 (7-day high), and $1,676 (MA30). A close above $1,676 would be the first meaningful bullish signal, but it would require a volume surge that is currently absent. Support at $1,512 (7-day low) is the immediate floor, with $1,506 (30-day low) acting as the last line before a potential drop to $1,400. The ETH/BTC ratio continues to decline, indicating that Ethereum is underperforming Bitcoin in this risk-off environment. Traders should watch for a break of $1,512—if it fails, the next leg lower could be swift.
Key Technical Levels
| Asset | Support | Resistance | RSI |
|---|---|---|---|
| BTC | $57,800 / $55,000 | $59,670 / $61,962 / $62,665 | 29.4 – oversold |
| ETH | $1,512 / $1,506 | $1,604 / $1,661 / $1,676 | 30.4 – oversold |
BTC vs ETH Dynamic
The correlation between Bitcoin and Ethereum remains high, with both assets moving in near lockstep over the past 24 hours. BTC’s 1.17% gain and ETH’s 1.28% gain reflect a 0.92 correlation coefficient, typical for risk-off periods. However, the relative performance over the past month tells a different story: BTC has declined 11.16% while ETH has fallen 14.40%, a 3.24% underperformance. This divergence is consistent with a market where capital is rotating toward Bitcoin as a "safer" store of value within crypto, while altcoins and Ethereum face greater selling pressure. The ETH/BTC ratio has dropped from 0.028 on June 1 to 0.027 today, a 3.6% decline. If this trend continues, Ethereum could test its support levels more aggressively than Bitcoin in the event of a broader sell-off. Conversely, any risk-on reversal would likely see Ethereum outperform, given its higher beta. For now, the dynamic favors Bitcoin as the relative strength leader.
Strategy Fit
Given the current market conditions—low volume, oversold RSI, and prices trading below key moving averages—a grid trading strategy is well-suited for the current environment. The tight intraday ranges (BTC ~$1,700, ETH ~$50) and low volatility create an opportunity for grid bots to capture small price movements without directional bias. On Pionex, the Infinity Grid bot can be deployed for both BTC/USDT and ETH/USDT to profit from mean reversion within the established support and resistance zones. For BTC, a grid between $57,800 and $59,670 (MA7) would target the current consolidation range. For ETH, a grid between $1,512 and $1,604 aligns with today’s range.
Alternatively, a DCA bot can be used to accumulate positions at these depressed levels. With BTC and ETH both in oversold territory, a dollar-cost averaging strategy with a 7-day or 14-day interval would buy at lower prices, reducing average entry cost. This is particularly suitable for long-term holders who believe the current valuation is attractive. However, given the lack of a confirmed bottom, a trend-following strategy is not recommended—the market lacks a clear trend direction, and both assets are below key moving averages. Traders should avoid leveraged positions until volume returns and a clear breakout above MA30 levels occurs. Pionex’s Reversal Grid bot can also be considered if a bounce materializes, but only after a confirmed move above $59,670 for BTC or $1,604 for ETH.
Risk Disclaimer
This market recap is for informational and educational purposes only and does not constitute financial advice, investment recommendation, or solicitation to buy or sell any digital assets. Cryptocurrency markets are highly volatile and involve substantial risk, including the potential loss of principal. Past performance is not indicative of future results. The technical indicators and levels discussed are based on historical data and may not predict future price movements. All trading decisions should be made based on your own research, risk tolerance, and financial situation. Consult a qualified financial advisor before making any investment decisions. The author and Pionex are not responsible for any losses incurred from trading activities.
FAQ
Q: Why is Bitcoin’s RSI at 29.4 considered oversold, and what does that mean for traders?
A: An RSI below 30 indicates that the asset has been sold off heavily and may be undervalued in the short term. Historically, oversold conditions often precede a bounce or reversal, but they can also persist in strong downtrends. Traders should look for confirmation—such as a volume spike or a close above MA7—before entering long positions. The current reading suggests selling pressure is exhausted, but it does not guarantee an immediate price increase.
Q: Ethereum’s volume is only 0.5x its 7-day average. Why is low volume a concern?
A: Low volume during a price bounce indicates that the move is not supported by strong buying interest. In a downtrend, low-volume rallies are often "dead cat bounces" that reverse quickly. For Ethereum, this means the 1.28% gain could be fleeting, and a retest of the $1,512 support is possible. Traders should wait for volume to increase above the 7-day average before considering a trend change.
Q: What are the key support and resistance levels for Bitcoin and Ethereum right now?
A: For Bitcoin, immediate support is at $57,800 (30-day low), with a break below targeting $55,000. Resistance is at $59,670 (MA7), then $61,962 (7-day high). For Ethereum, support is at $1,512 (7-day low) and $1,506 (30-day low). Resistance is at $1,604 (24-hour high), $1,661 (7-day high), and $1,676 (MA30). These levels are based on recent price action and moving averages.
Q: How does the BTC vs ETH dynamic affect trading strategies?
A: The high correlation (0.92) means that strategies for BTC often apply to ETH, but Ethereum’s higher beta (greater volatility) can amplify gains or losses. In a risk-off environment, Bitcoin is relatively stronger, so traders may prefer BTC for grid or DCA strategies. If a risk-on reversal occurs, ETH could outperform, making it a better candidate for trend-following bots. The ETH/BTC ratio is a useful indicator—if it stops declining, it may signal a shift.
Q: What is the best trading strategy for today’s market conditions?
A: Given low volume and oversold RSI, a grid trading strategy is recommended for capturing small price movements within the current ranges. For BTC, a grid between $57,800 and $59,670 works; for ETH, between $1,512 and $1,604. Alternatively, a DCA bot can accumulate positions at these levels for long-term holding. Avoid leveraged or trend-following strategies until volume returns and prices break above MA30. Pionex offers both Infinity Grid and DCA bots that can be set up with these parameters.


