BTC ETH Daily Recap — 2026-06-06
BTC ETH Daily Recap — 2026-06-06
Today at a Glance
The crypto market continues to face significant selling pressure as of June 6, 2026, with both Bitcoin and Ethereum extending their multi-week downtrends. Bitcoin is trading at $60,896, down 0.26% in the last 24 hours, after touching a daily low of $59,500 and a high of $61,530. The asset has now lost 17.58% over the past week and 24.06% over the past month, with the 7-day high of $74,276 now a distant memory. Ethereum is under even more severe strain, currently at $1,561, down 1.44% in the day. Its 7-day decline of 22.84% and 30-day drop of 32.36% underscore a deepening bearish phase. Both assets recorded their lowest prices in the last 30 days today — $59,131 for BTC and $1,506 for ETH — while volume remains notably below average (BTC at 0.52x, ETH at 0.77x of their respective 7-day averages). The RSI readings are deep into oversold territory, with BTC at 5.6 and ETH at 4.2, signaling extreme bearish sentiment but also potential for a short-term bounce.
Bitcoin Analysis
TradingView Live (4h)
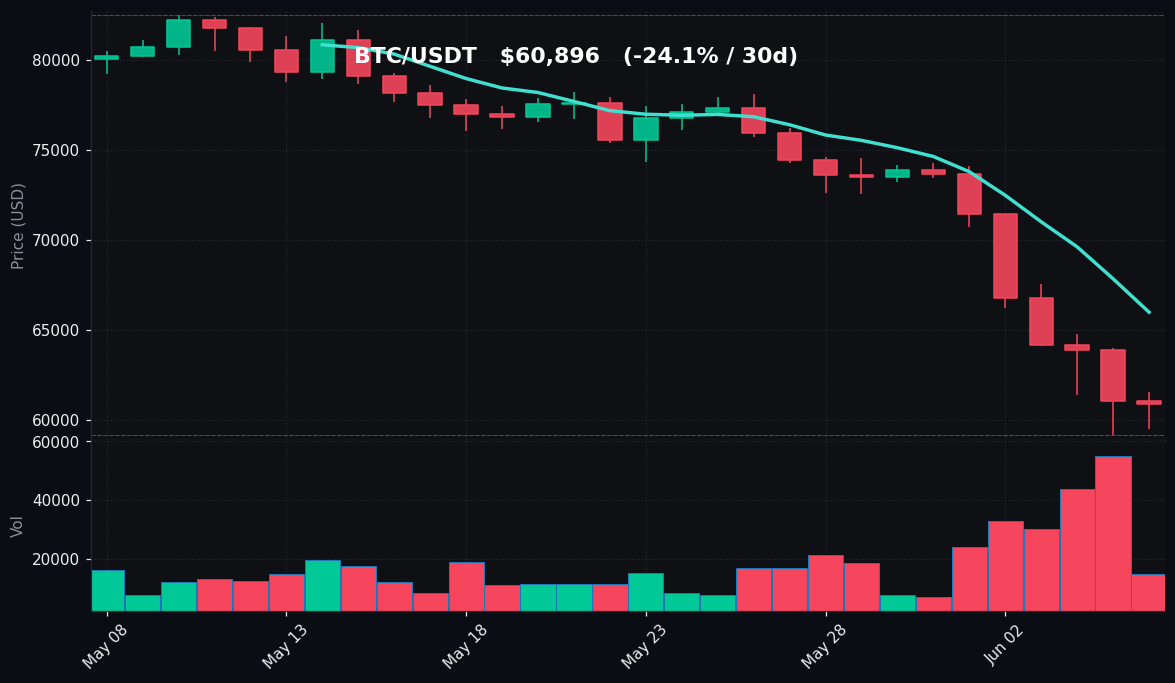
Bitcoin’s price action over the past 24 hours shows a market in consolidation near the lower end of its recent range. After plunging from a 7-day high of $74,276 to a low of $59,131, BTC has found temporary footing around the $60,000 psychological level. The intraday range was relatively narrow ($59,500–$61,530), suggesting a pause in the aggressive selling that dominated the prior week. However, the lack of volume — only 0.52 times the 7-day average — indicates that this consolidation may be a period of indecision rather than accumulation. Traders are cautious, with many waiting for a clear catalyst or further price discovery.
From a technical perspective, Bitcoin is trading well below both its 7-day moving average (MA7: $65,975) and its 30-day moving average (MA30: $74,977). The MA7 has crossed decisively below the MA30, forming a bearish death cross pattern that typically signals sustained downward momentum. The distance between price and MA30 is over $14,000, or roughly 19%, highlighting the severity of the recent sell-off. The RSI(14) reading of 5.6 is extraordinarily low — levels not seen since the depths of the 2022 bear market. While this indicates extreme oversold conditions and the potential for a relief rally, it does not guarantee an immediate reversal. In previous instances where BTC’s RSI dipped below 10, the asset often saw a sharp but temporary bounce within 1–3 days, followed by further consolidation or continued decline.
Key support levels to watch include the recent low at $59,131, followed by the psychological $58,000 and $55,000 zones. On the upside, immediate resistance sits at $61,530 (today’s high), then the MA7 at $65,975, and finally the $70,000 round number. The volume profile is concerning: the 0.52x reading relative to the 7-day average suggests that selling pressure may be waning, but it also means there is insufficient buying interest to push prices higher. A volume spike, either on a break below $59,000 or above $62,000, would provide clearer directional cues. Until then, BTC remains in a bearish trend with oversold conditions that warrant caution, not aggressive bottom-fishing.
Ethereum Analysis
TradingView Live (4h)
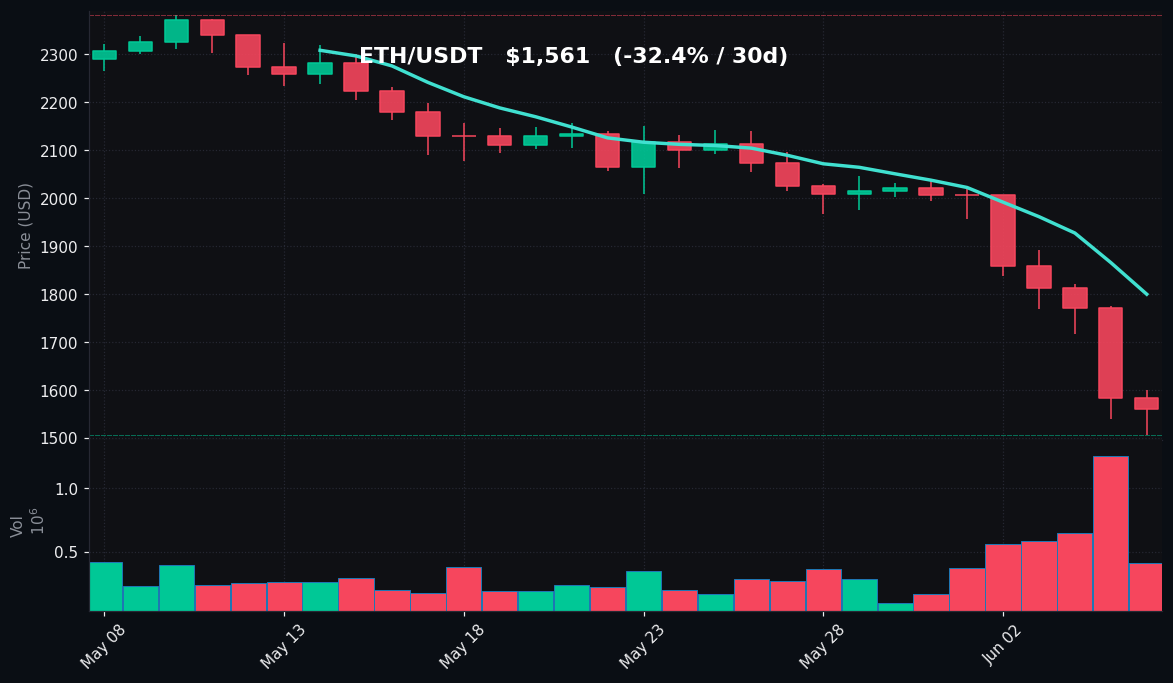
Ethereum’s price trajectory is even more bearish than Bitcoin’s, with the asset trading at $1,561 after a 1.44% decline in the last 24 hours. The intraday range of $1,506–$1,601 shows ETH testing a new 30-day low of $1,506, which is also its lowest level in several months. The 7-day decline of 22.84% and 30-day drop of 32.36% paint a picture of accelerating losses, with ETH underperforming BTC by a significant margin. Volume is at 0.77x the 7-day average, which is relatively higher than BTC’s but still below normal levels, indicating that selling pressure is present but not panic-driven.
Technically, Ethereum is deeply embedded in a bearish structure. The price is far below both its MA7 ($1,800) and MA30 ($2,078), with the MA7 having crossed below the MA30 in a death cross that occurred approximately two weeks ago. The gap between current price and MA30 is over $500, or roughly 24%, reflecting the asset’s steep decline. The RSI(14) reading of 4.2 is even more extreme than BTC’s, entering territory that has historically preceded sharp short-term bounces. In the past, when ETH’s RSI has fallen below 5, the asset has often seen a 10–15% rally within the following week, though these bounces have frequently been sold into.
Key support levels are the recent low at $1,506, followed by the psychological $1,500 mark and the $1,400 zone. Resistance is at $1,601 (today’s high), then $1,700, and the MA7 at $1,800. The volume dynamics suggest that while selling is not accelerating, buyers are not stepping in aggressively. The relative strength of ETH volume (0.77x vs BTC’s 0.52x) may indicate that some traders are trying to catch a falling knife, but the lack of follow-through is concerning. Ethereum’s correlation with Bitcoin remains high, but its larger percentage declines indicate that it is being disproportionately affected by the current risk-off sentiment in the market. The extreme RSI readings do not guarantee a reversal, but they do suggest that any positive catalyst could trigger a sharp, though likely temporary, recovery.
Key Technical Levels
| Asset | Support | Resistance | RSI |
|---|---|---|---|
| BTC | $59,131 / $58,000 | $61,530 / $65,975 | Oversold (5.6) |
| ETH | $1,506 / $1,500 | $1,601 / $1,800 | Oversold (4.2) |
BTC vs ETH Dynamic
The correlation between Bitcoin and Ethereum remains strong, but the divergence in their performance is notable. Over the past 30 days, BTC has fallen 24.06%, while ETH has dropped 32.36%, meaning ETH has declined roughly 1.34 times more than BTC. This is a common pattern in bearish phases: altcoins and major second-tier assets like ETH tend to experience amplified losses as liquidity dries up and traders rotate into BTC as a relative safe haven. The BTC dominance ratio has likely increased during this period. The 7-day performance gap (BTC -17.58% vs ETH -22.84%) further confirms that ETH is bearing the brunt of selling pressure. However, this also means that if a relief rally materializes, ETH may bounce more aggressively due to its higher beta and extreme oversold RSI. The current dynamic suggests a market that is risk-averse, with capital flowing toward the largest asset by market cap.
Strategy Fit
Given the extreme oversold conditions and low volume, the current market environment is challenging for directional strategies. Trend-following approaches are risky because the downtrend is mature and a reversal could occur at any time, while chasing the trend could lead to buying near the bottom. Grid trading bots, such as those offered by Pionex, are well-suited to this range-bound, low-volatility environment. A neutral grid set between $58,000–$62,000 for BTC and $1,500–$1,600 for ETH could capture profits from the small intraday oscillations. However, given the potential for a sharp breakout, a volatility-adaptive grid or a bot with stop-loss features is advisable. Dollar-cost averaging (DCA) is another viable strategy for long-term holders, as the current prices are significantly below the 30-day averages, allowing for accumulation at discounted levels. Pionex’s DCA bots can automate this process with fixed intervals. For aggressive traders, a small allocation to a long position with a tight stop below recent lows could be considered, but this is high-risk. Overall, a cautious, non-directional approach using grid or DCA bots is recommended until volume and price action provide clearer signals.
Risk Disclaimer
This market recap is for informational and educational purposes only. It does not constitute financial advice, investment recommendations, or trading signals. Cryptocurrency markets are highly volatile and involve significant risk, including the potential loss of principal. Past performance is not indicative of future results. All trading decisions should be made based on your own research, risk tolerance, and financial situation. Consult with a qualified financial advisor before engaging in any trading or investment activities.
FAQ
Q: Why is Bitcoin’s RSI so low at 5.6?
A: An RSI of 5.6 indicates that Bitcoin is extremely oversold, meaning the price has fallen sharply and rapidly over the past 14 days. This typically happens during panic selling or capitulation events. While it suggests a potential bounce is possible, it does not guarantee one, as prices can remain oversold in strong downtrends.
Q: What does the volume being below average mean?
A: Volume at 0.52x the 7-day average for BTC means that fewer trades are occurring compared to the recent norm. Low volume during a consolidation phase often signals indecision — neither buyers nor sellers are aggressively stepping in. A breakout or breakdown with increased volume would provide more conviction.
Q: Is Ethereum’s drop worse than Bitcoin’s?
A: Yes. Over the past 7 and 30 days, Ethereum has underperformed Bitcoin significantly, with declines of 22.84% and 32.36% respectively, compared to BTC’s 17.58% and 24.06%. This is typical in bear markets, where higher-beta assets like ETH tend to fall more.
Q: What are the key levels to watch for a potential reversal?
A: For BTC, a break above $61,530 (today’s high) and then $65,975 (MA7) would signal short-term strength. For ETH, a move above $1,601 and then $1,800 would be bullish. On the downside, a loss of $59,131 for BTC or $1,506 for ETH would open the door to further declines.
Q: Should I buy the dip now?
A: This is not a recommendation to buy or sell. The extreme oversold readings suggest that a bounce could occur, but the trend remains bearish. Any dip-buying should be done with strict risk management, such as using stop-losses and position sizing, and only with capital you can afford to lose.