BTC ETH Daily Recap – 2026-06-25: Deep Correction Tests Key Support Levels

BTC ETH Daily Recap – 2026-06-25: Deep Correction Tests Key Support Levels
Today at a Glance
The crypto market extended its bearish momentum on June 25, 2026, with both Bitcoin and Ethereum posting significant daily losses. Bitcoin (BTC) fell 3.51% over the past 24 hours, settling at $58,934, after touching a daily low of $58,115 – the lowest point in the last 30 days. The weekly and monthly performance remains deeply negative, with BTC down 6.39% over the past seven days and a steep 20.84% decline over the past 30 days. Ethereum (ETH) fared worse on a relative basis, dropping 3.91% in the last 24 hours to $1,559, with its daily low of $1,533 approaching the 30-day floor of $1,506. ETH’s seven-day loss of 8.91% and 30-day drawdown of 23.02% underscore the persistent weakness across the altcoin space. Both assets are now trading below their critical moving averages (MA7 and MA30), while the Relative Strength Index (RSI) for BTC sits at 33.6 (near oversold territory) and ETH at 38.0 (neutral-bearish). Trading volumes remain near average, suggesting the sell-off is orderly rather than panic-driven, yet the absence of buying conviction keeps the market vulnerable to further downside.
Bitcoin Analysis
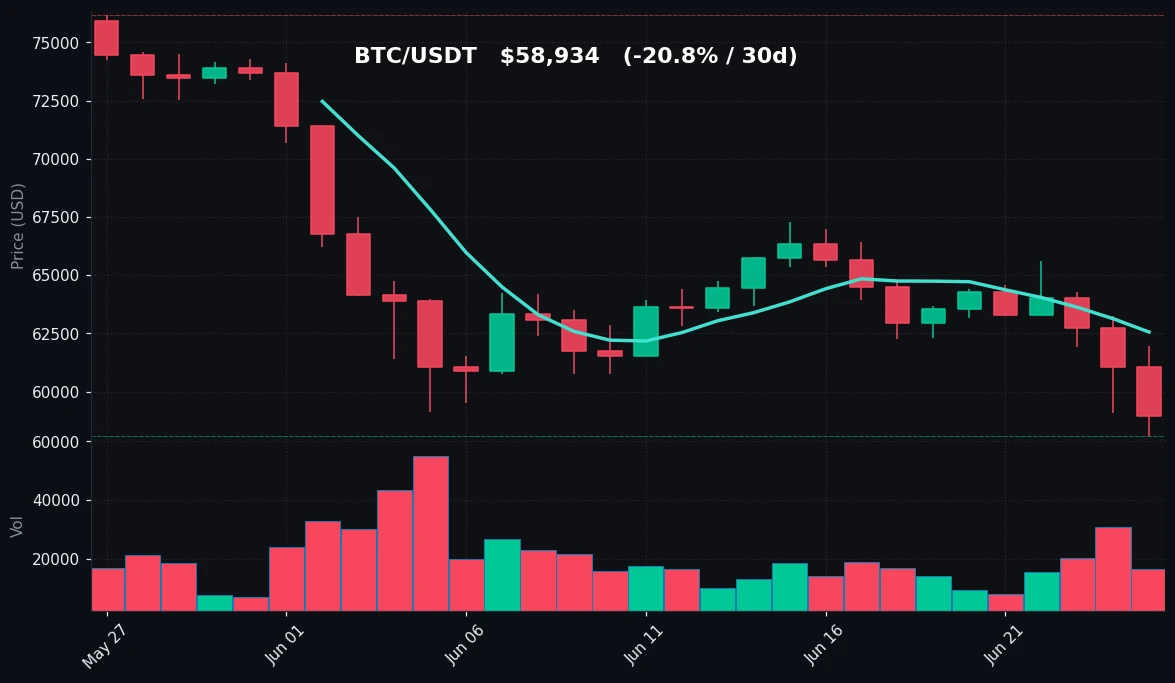
TradingView Live (4h)
Bitcoin’s price action on June 25, 2026, reflects a continuation of the downtrend that began in late May. The daily decline of 3.51% drove BTC from its intraday high of $61,962 to a low of $58,115, before a modest bounce brought the closing price to $58,934. The $58,115 low is significant as it marks the lowest point in the past 30 days, matching the 30-day low recorded on June 24. This level now serves as a critical near-term support zone.
From a technical perspective, Bitcoin is trading decisively below both its 7-day moving average (MA7) of $62,560 and its 30-day moving average (MA30) of $65,390. The gap between the current price and the MA30 has widened to approximately $6,456, or about 9.9%, indicating strong bearish momentum. The MA7 has crossed below the MA30, a classic "death cross" pattern on the short-term timeframe, which typically signals continued downside pressure.
The RSI(14) reading of 33.6 places Bitcoin in the lower end of the neutral range, just above the oversold threshold of 30. While not yet oversold, the RSI has been declining steadily from the 50 level seen a week ago, reflecting accelerating selling pressure. Historically, an RSI below 35 has often preceded short-term bounces, but the current trend suggests that any recovery may be shallow unless accompanied by a significant increase in buying volume.
Volume analysis shows that the 24-hour trading volume is essentially flat compared to the 7-day average (1.01x), indicating that the sell-off is not accompanied by panic selling or capitulation. This lack of volume conviction could be interpreted in two ways: either the market is still searching for a bottom with sellers gradually exhausting, or the absence of aggressive buying means the downtrend could persist. The 7-day high of $65,623 and the 30-day high of $76,174 highlight the magnitude of the recent decline, with BTC now trading 10.2% below its 7-day high and 22.6% below its 30-day high.
Key technical levels to watch include immediate support at $58,115 (the 30-day low), followed by the psychological $58,000 mark. A break below this zone could open the door to the $55,000-$56,000 area, which represents the next major demand zone from early May. On the upside, resistance is clustered around $60,000 (round number), then the MA7 at $62,560, and finally the MA30 at $65,390. The price would need to reclaim and hold above $62,500 to suggest a potential trend reversal.
Ethereum Analysis
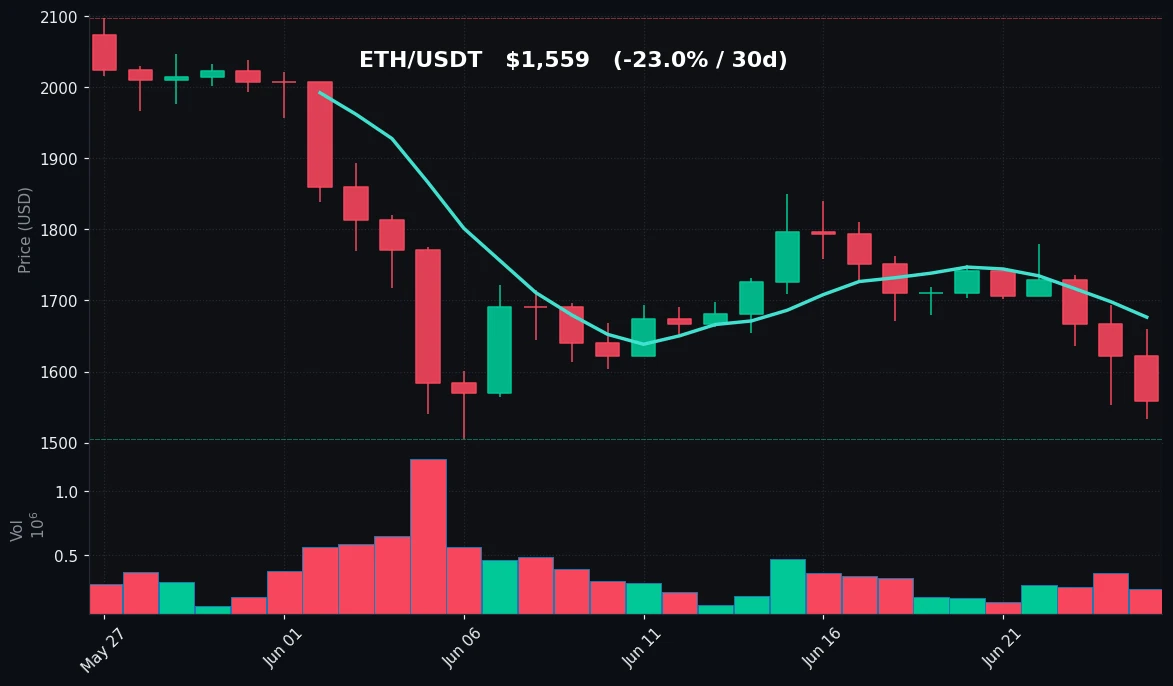
TradingView Live (4h)
Ethereum’s performance on June 25, 2026, mirrored Bitcoin’s weakness but with greater intensity, as ETH dropped 3.91% to close at $1,559. The intraday range saw a high of $1,661 and a low of $1,533, with the latter approaching the 30-day low of $1,506 recorded earlier in the month. The 7-day decline of 8.91% and 30-day drop of 23.02% highlight Ethereum’s underperformance relative to Bitcoin during this correction phase.
Technically, Ethereum is trading well below its key moving averages. The MA7 of $1,676 and MA30 of $1,762 represent significant overhead resistance zones. The current price of $1,559 is approximately 7.0% below the MA7 and 11.5% below the MA30, indicating bearish momentum that is even more pronounced than Bitcoin’s. The moving average structure shows a clear bearish alignment, with the MA7 trending downward and below the MA30.
The RSI(14) for Ethereum stands at 38.0, which is in the neutral-bearish zone but slightly higher than Bitcoin’s reading. This suggests that while selling pressure is strong, ETH has not yet reached oversold conditions. The RSI has been declining from the 45 level a week ago, consistent with the broader downtrend. The 30-day high of $2,097 and the 7-day high of $1,780 underline the rapid deterioration in price, with ETH now trading 25.7% below its 30-day peak.
Volume analysis reveals that ETH’s 24-hour trading volume is 0.99x its 7-day average, essentially in line with recent activity. This lack of volume expansion during the sell-off suggests that the decline is driven by persistent selling rather than a sudden wave of panic. However, it also indicates that buyers are not stepping in aggressively at current levels, which could prolong the downtrend.
Key support levels for Ethereum include the 30-day low at $1,506, followed by the psychological $1,500 mark. A break below this zone would likely target the $1,400-$1,450 area, which represents the next significant support from early May. On the resistance side, immediate hurdles are at $1,600 (round number), then the MA7 at $1,676, and finally the MA30 at $1,762. The $1,700 level also serves as a psychological barrier that ETH has not been able to reclaim since June 20.
Key Technical Levels
| Asset | Support | Resistance | RSI |
|---|---|---|---|
| BTC | $58,115 (30d low), $58,000 (psychological), $55,000-$56,000 (next demand zone) | $60,000 (round), $62,560 (MA7), $65,390 (MA30) | 33.6 – neutral (near oversold) |
| ETH | $1,506 (30d low), $1,500 (psychological), $1,400-$1,450 (next support) | $1,600 (round), $1,676 (MA7), $1,762 (MA30) | 38.0 – neutral-bearish |
BTC vs ETH Dynamic
The correlation between Bitcoin and Ethereum remains strong during this correction phase, with both assets experiencing nearly identical percentage declines on a daily basis (BTC -3.51% vs ETH -3.91%). However, Ethereum’s relative weakness is evident in its deeper 7-day (-8.91% vs -6.39%) and 30-day (-23.02% vs -20.84%) drawdowns. The ETH/BTC ratio has declined from approximately 0.0270 a week ago to 0.0265 on June 25, reflecting Ethereum’s underperformance. This pattern is typical of bearish market phases, where higher-beta assets like ETH tend to fall more than Bitcoin. The RSI divergence is notable: BTC at 33.6 is closer to oversold territory, while ETH at 38.0 has more room to decline before reaching similar conditions. This suggests that if the market continues to weaken, ETH may experience sharper percentage declines relative to BTC. Conversely, if a relief rally materializes, ETH could outperform due to its higher volatility.
Strategy Fit
Given the current market environment characterized by strong downtrends, oversold RSI readings, and below-average volume, the most appropriate trading strategies involve risk management and accumulation rather than aggressive directional bets.
Grid Trading: The high volatility and wide price ranges (BTC ranging $58,115-$61,962, ETH ranging $1,533-$1,661 in 24 hours) make grid trading a suitable strategy for capturing profits from short-term price oscillations. However, the strong downward bias means that a neutral or short-biased grid (with more sell orders than buy orders) would be more appropriate. Pionex’s grid trading bots can automate this process, allowing users to set a price range that captures the current volatility while maintaining downside protection. A grid strategy with a range of $57,000-$62,000 for BTC and $1,480-$1,700 for ETH would cover the current trading zones.
Dollar-Cost Averaging (DCA): The extended correction with BTC down 20.84% and ETH down 23.02% over 30 days presents a compelling DCA opportunity for long-term holders. DCA allows investors to accumulate positions at progressively lower prices, reducing the impact of market timing. Pionex’s DCA bot can be configured with daily or weekly intervals, with the current price levels offering attractive entry points for those with a multi-month to multi-year horizon. However, given that the RSI is not yet oversold, a conservative approach with smaller position sizes is recommended.
Trend Following: The current trend is clearly bearish, and short-term trend-following strategies would favor selling rallies. However, the risk of a short squeeze or relief bounce is elevated given the oversold RSI readings. A prudent approach would be to wait for a confirmed reversal signal, such as a bullish RSI divergence or a break above the MA7, before initiating long positions. For short-term traders, using Pionex’s futures grid bots with a short bias could capture further downside, but strict stop-losses are essential.
Accumulation Strategy: For risk-tolerant investors, the current levels represent a potential accumulation zone. Combining DCA with a limit order strategy at key support levels ($58,000 for BTC, $1,500 for ETH) can provide a structured approach to building positions during the dip. Pionex’s limit order bot can automate this process, placing buy orders at predetermined levels without requiring constant monitoring.
Risk Disclaimer
This market recap is provided for informational and educational purposes only and does not constitute financial advice, investment recommendation, or solicitation to buy, sell, or hold any digital assets. Cryptocurrency markets are highly volatile and involve substantial risk, including the potential loss of principal. Past performance and historical patterns do not guarantee future results. The technical analysis presented herein is based on publicly available data and should not be relied upon as the sole basis for investment decisions. You should consult with a qualified financial advisor and conduct your own independent research before engaging in any trading or investment activity. The author and platform assume no liability for any losses incurred from the use of this information.
FAQ
Q: Why did Bitcoin and Ethereum drop so sharply on June 25, 2026?
A: The decline on June 25 is part of a broader correction that has been ongoing for 30 days. Technical factors include both assets trading below their key moving averages (MA7 and MA30), with bearish crossovers. The RSI readings near oversold territory suggest selling pressure has been persistent, though volume remains average, indicating the move is orderly rather than panic-driven. No single catalyst was identified in the data, but the market continues to digest macro headwinds and profit-taking from earlier highs.
Q: Is Bitcoin oversold at RSI 33.6?
A: An RSI of 33.6 is in the neutral-bearish zone, just above the oversold threshold of 30. While not technically oversold, the reading indicates strong bearish momentum. Historically, RSI levels below 35 have sometimes preceded short-term bounces, but the trend remains downward. Traders should watch for a potential oversold reading below 30, which could signal a more compelling reversal opportunity.
Q: What are the most important support levels for BTC and ETH right now?
A: For Bitcoin, the immediate support is at $58,115 (the 30-day low), followed by the psychological $58,000 level. A break below this could target $55,000-$56,000. For Ethereum, the key support is at $1,506 (30-day low) and the $1,500 round number. Below that, the next major support zone is $1,400-$1,450. Both assets would need to reclaim their MA7 levels to suggest a potential trend change.
Q: How does Ethereum’s performance compare to Bitcoin during this correction?
A: Ethereum has underperformed Bitcoin over the past 7 days (-8.91% vs -6.39%) and 30 days (-23.02% vs -20.84%). The ETH/BTC ratio has declined, reflecting this relative weakness. This pattern is typical in bear markets, where higher-beta altcoins fall more than Bitcoin. Ethereum’s RSI of 38.0 is higher than Bitcoin’s 33.6, suggesting it may have more room to decline before reaching oversold conditions.
Q: What trading strategies are most suitable in the current market environment?
A: Given the strong downtrend and near-oversold conditions, a combination of conservative DCA for long-term accumulation and grid trading within a wide range to capture volatility is recommended. Trend-following strategies should be approached with caution until a clear reversal signal appears. Using automated bots like Pionex’s grid or DCA bots can help execute these strategies systematically while managing risk. Risk management through position sizing and stop-losses is critical in this volatile environment.


