BTC ETH Daily Recap | 2026-06-26

BTC ETH Daily Recap | 2026-06-26
Today at a Glance
The crypto market continues to face downward pressure as both Bitcoin and Ethereum trade near their 30-day lows. BTC/USDT is currently at $60,013, showing a marginal 24-hour gain of +0.37% after bouncing from a low of $58,337, though it remains down -5.56% over the past week and -18.48% over the last 30 days. Ethereum is slightly weaker, trading at $1,564 with a -0.23% 24-hour change, -8.58% weekly decline, and -22.17% monthly drawdown. Volume for both assets is slightly elevated compared to their 7-day averages, with BTC at 1.09x and ETH at 1.14x, indicating increased trader activity near these support levels. RSI readings for both assets remain in oversold territory, with BTC at 36.9 and ETH at 39.0, suggesting the selling momentum may be exhausting but buyers have yet to step in decisively.
Bitcoin Analysis
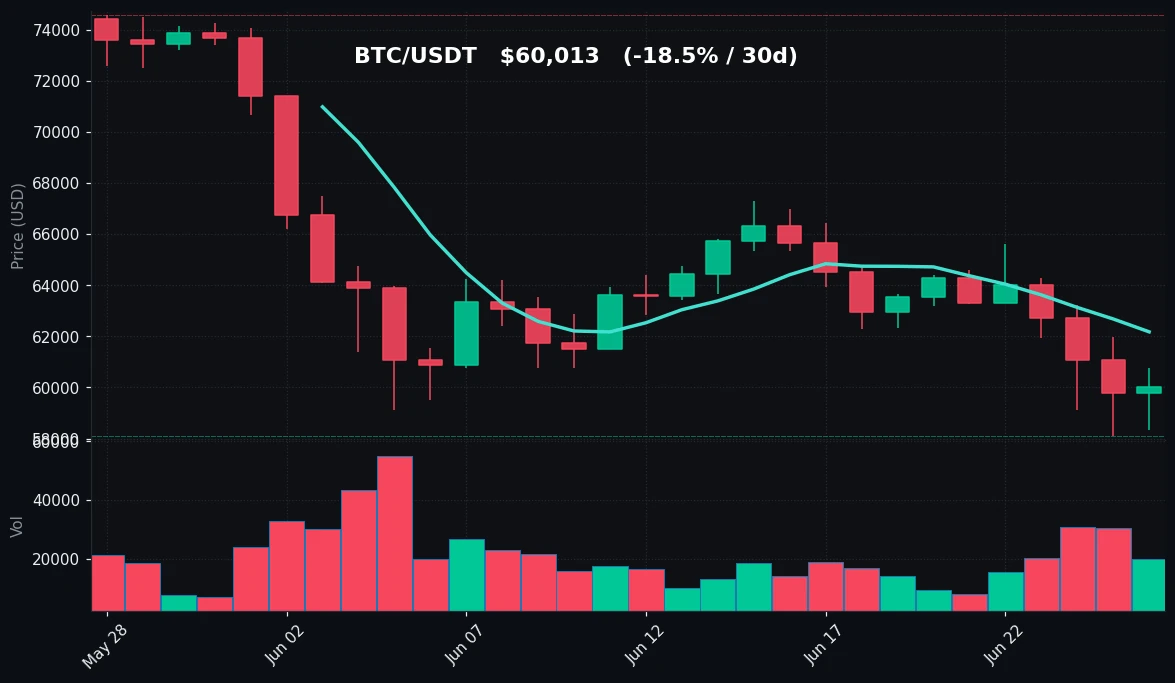
TradingView Live (4h)
Bitcoin's price action over the past 24 hours shows an intraday range of $58,337 to $60,760, with the asset currently consolidating near the $60,000 psychological level. The bounce from the daily low of $58,337, which also coincides with the 30-day low, suggests a potential support test that has held for now. However, the broader trend remains bearish, as evidenced by the -5.56% weekly loss and the significant -18.48% monthly decline. The 7-day moving average (MA7) sits at $62,179, well above the current price, indicating short-term bearish momentum. The 30-day moving average (MA30) at $64,937 further confirms the downward trajectory, as the price has been trading below both key moving averages for several days.
Volume analysis reveals a 1.09x ratio compared to the 7-day average, meaning today's trading activity is slightly above normal. This uptick in volume during a price bounce from support could indicate accumulation, but it could also represent short-term profit-taking by bears. The RSI(14) at 36.9 is firmly in oversold territory (below 30 would be extreme oversold). Historically, Bitcoin has seen brief relief rallies when the RSI dips into the mid-30s, but sustained bearish trends often require the RSI to remain oversold for extended periods before a meaningful reversal.
Key technical observations: The $58,115 level (30-day low) serves as the immediate support floor, with a break below that opening the path toward the $55,000 region. On the upside, resistance is clustered around the MA7 at $62,179, followed by the $65,623 weekly high. The price action suggests a tug-of-war between bears testing lower levels and bulls defending the $58,000-$60,000 zone. Without a catalyst, the path of least resistance remains lower, but the oversold RSI warrants caution for aggressive short sellers.
Ethereum Analysis
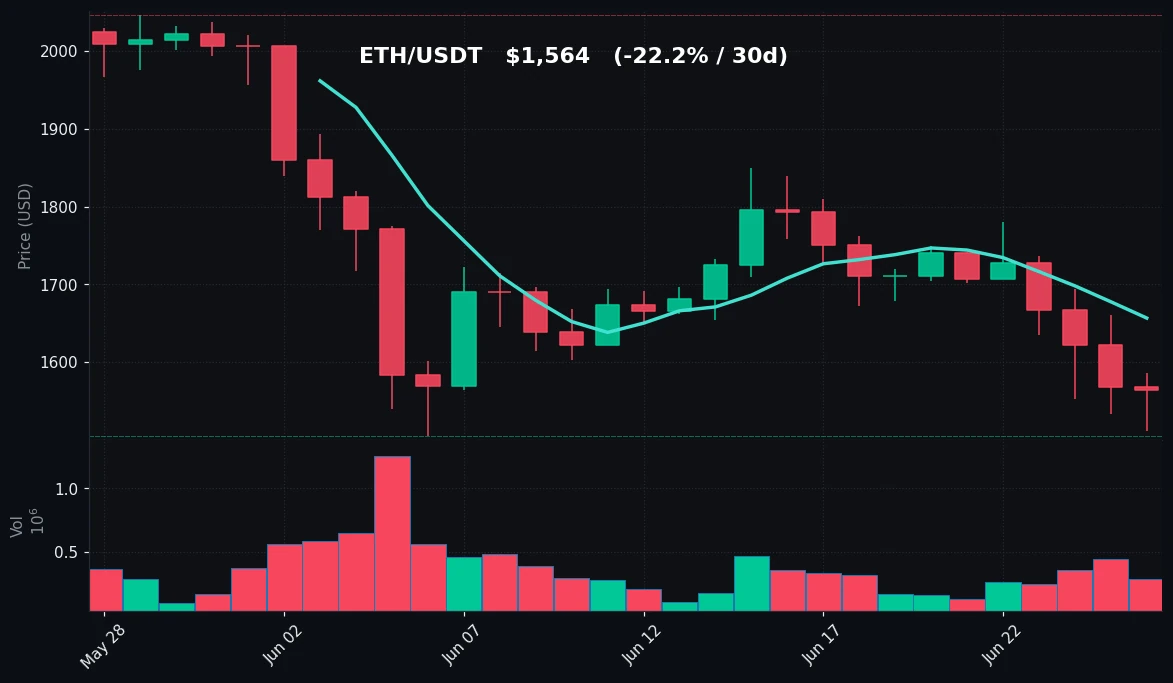
TradingView Live (4h)
Ethereum is trading at $1,564, showing a -0.23% 24-hour change after touching a low of $1,512 and a high of $1,586. The asset has been under more severe pressure than Bitcoin over the past week (-8.58%) and month (-22.17%), reflecting weaker relative strength. The 30-day low of $1,506 is dangerously close to the current price, and today's low of $1,512 nearly tested that level. The MA7 at $1,657 and MA30 at $1,747 are both significantly above the current price, confirming the bearish structure. The price has not closed above the MA7 since June 19, a period of seven consecutive trading days of relative weakness.
Volume for Ethereum is 1.14x its 7-day average, indicating heightened interest near these lows. The RSI(14) at 39.0 is in oversold territory but slightly higher than Bitcoin's, suggesting ETH may have a bit more room to fall before reaching extreme oversold conditions. The divergence between BTC and ETH's RSI (BTC 36.9 vs ETH 39.0) is notable, as historically ETH tends to lead BTC during recoveries, but currently, BTC is showing more relative strength.
From a technical perspective, the $1,506-$1,512 zone is the critical support to watch. A breakdown below this level could trigger a move toward $1,400, which has not been tested since late 2023. Resistance sits at $1,586 (today's high), followed by the MA7 at $1,657 and the weekly high of $1,780. The volume profile shows that selling pressure has been consistent, with no significant accumulation pattern evident. The oversold RSI may attract dip buyers, but the lack of a bullish catalyst and the broader market weakness suggest that any bounce could be short-lived unless accompanied by a sharp volume spike.
Key Technical Levels
| Asset | Support | Resistance | RSI |
|---|---|---|---|
| BTC | $58,115 | $62,179 | Oversold (36.9) |
| ETH | $1,506 | $1,657 | Oversold (39.0) |
BTC vs ETH Dynamic
The correlation between Bitcoin and Ethereum remains high, with both assets trading in similar bearish patterns. However, Ethereum's underperformance is clear: BTC's 30-day decline of -18.48% is significantly less severe than ETH's -22.17%, and the ETH/BTC ratio has been trending lower. This divergence suggests that capital is rotating out of altcoins and into Bitcoin during the sell-off, a typical risk-off behavior in crypto markets. If Bitcoin can hold above $58,000 and stage a recovery, Ethereum may see a catch-up rally, but for now, the relative strength is firmly in BTC's favor. The RSI gap (BTC 36.9 vs ETH 39.0) is relatively narrow, indicating that both assets are experiencing similar selling pressure, but BTC has a slightly stronger oversold signal.
Strategy Fit
Given the current market conditions of high volatility, oversold RSI readings, and bearish trends, a multi-strategy approach is recommended. Grid trading is well-suited for the current sideways-to-downward movement, as the price is oscillating within defined ranges (BTC: $58,000-$62,000, ETH: $1,500-$1,650). A neutral grid can capture profits from these intraday swings without directional bias. Dollar-cost averaging (DCA) is appropriate for long-term accumulators, as the 30-day lows present attractive entry points for those with a multi-month horizon. Trend-following strategies are not recommended in the current environment, as the market lacks a clear directional trend—the oversold RSI could lead to a bounce, but the bearish moving averages suggest further downside. Pionex's built-in grid trading bots are ideal for this environment, allowing users to set automated buy and sell orders within the defined support and resistance zones. Additionally, Pionex's DCA bot can be configured to accumulate BTC and ETH at these discounted levels with periodic investments, reducing timing risk.
Risk Disclaimer
This market recap is for informational and educational purposes only and does not constitute financial advice, investment recommendations, or trading signals. Cryptocurrency markets are highly volatile and involve substantial risk of loss. Past performance and technical indicators are not guarantees of future results. Always conduct your own research (DYOR) and consult with a qualified financial advisor before making any investment decisions. The data presented is based on publicly available information and may contain errors or omissions. The author and platform assume no liability for any financial losses incurred.
FAQ
Q: Why is Bitcoin's RSI at 36.9 considered oversold?
A: The Relative Strength Index (RSI) measures the magnitude of recent price changes to evaluate overbought or oversold conditions. Readings below 30 are considered oversold, while above 70 are overbought. At 36.9, BTC is approaching oversold territory but not yet in extreme oversold conditions. This suggests selling pressure has been strong but may be exhausting, though it does not guarantee a reversal.
Q: What does it mean that both BTC and ETH are trading below their 7-day and 30-day moving averages?
A: When an asset trades below both its short-term (7-day) and medium-term (30-day) moving averages, it indicates a bearish trend. The MA7 ($62,179 for BTC) being above the current price ($60,013) shows that recent price action is weaker than the average of the past week, while the MA30 ($64,937) confirms the downtrend over the past month. This is a classic bearish signal.
Q: How does the volume ratio of 1.09x (BTC) and 1.14x (ETH) affect market analysis?
A: Volume ratios compare current trading activity to the 7-day average. A ratio above 1.0 indicates higher-than-normal volume. In a downtrend, elevated volume can confirm selling pressure, but when combined with a bounce from support (as seen today), it may signal accumulation. The key is to watch whether volume increases during subsequent price advances, which would confirm buying interest.
Q: What are the key support levels to watch for BTC and ETH?
A: For Bitcoin, the immediate support is the 30-day low of $58,115, which was nearly tested today at $58,337. A break below this level could open the door to $55,000. For Ethereum, the critical support is $1,506 (30-day low), with today's low at $1,512. Below that, $1,400 is the next major support, which has not been tested since late 2023.
Q: Is this a good time to start DCA (dollar-cost averaging) into BTC and ETH?
A: DCA is generally considered a prudent strategy during bearish phases, as it reduces the impact of volatility and timing risk. With both assets near their 30-day lows and RSI in oversold territory, the current prices may offer attractive entry points for long-term accumulators. However, it is important to note that prices could still decline further, so DCA should be part of a broader risk management plan that aligns with your financial goals and risk tolerance.


