BTC ETH Daily Recap – 2026-06-24

BTC ETH Daily Recap – 2026-06-24
Today at a Glance
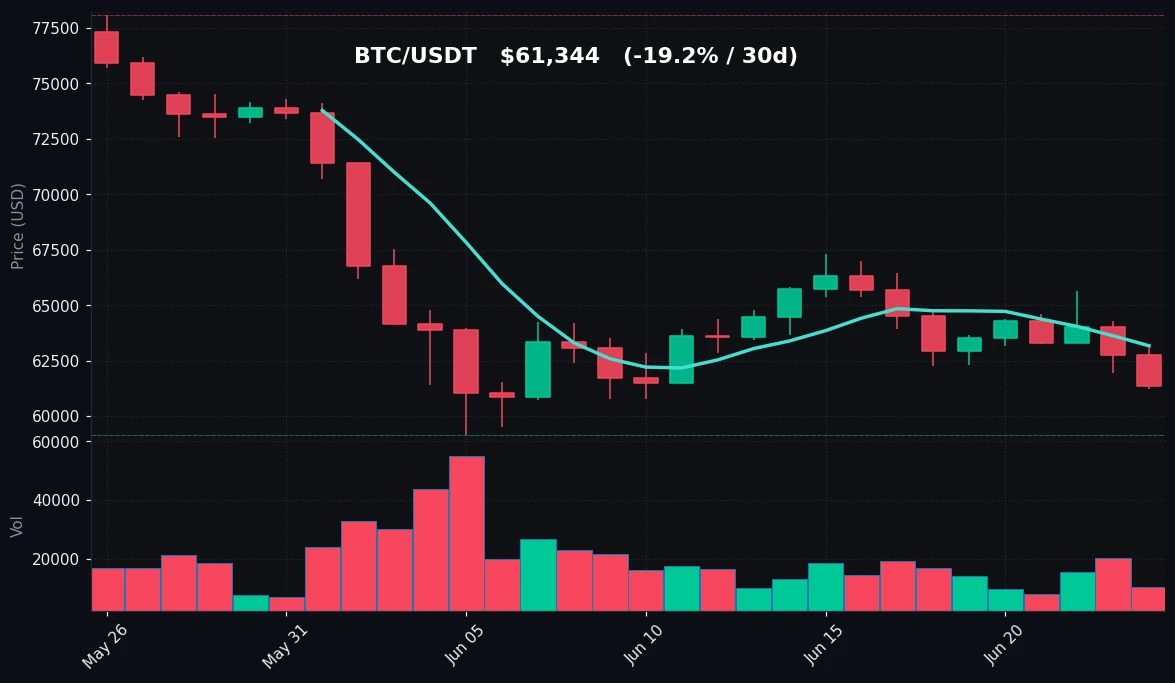
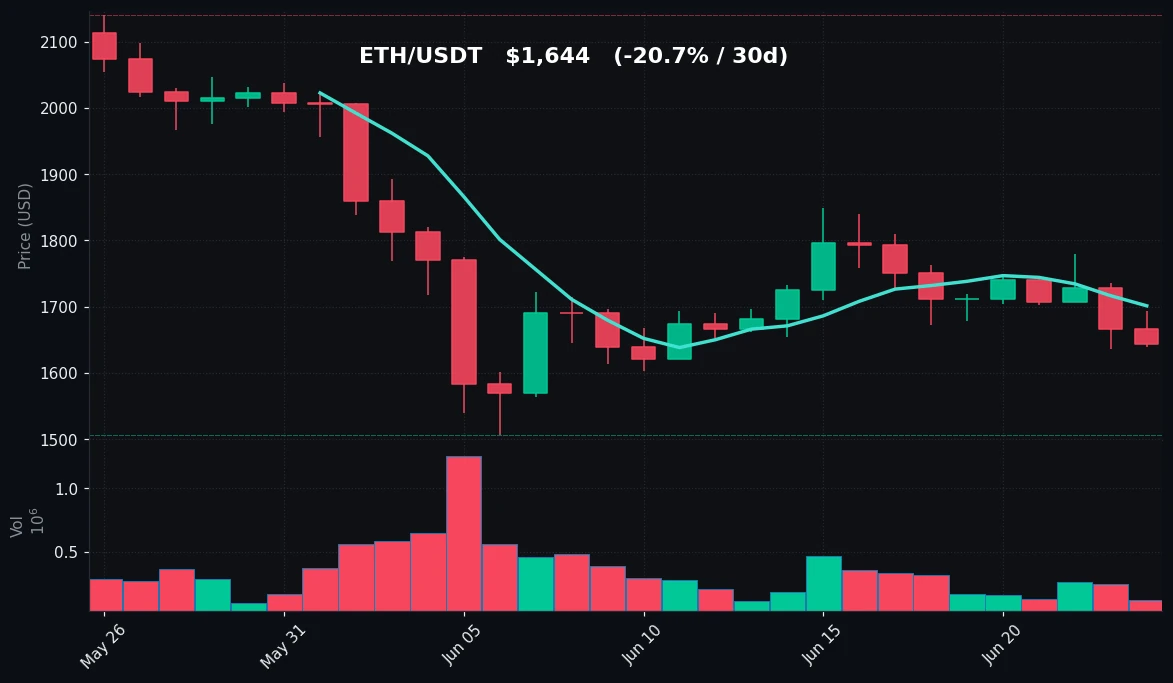
The crypto market extended its weekly decline on June 24, 2026, with both Bitcoin and Ethereum posting negative 24-hour returns. Bitcoin fell 2.22% to $61,344, touching a session low of $61,206 before recovering slightly, while Ethereum dropped 1.39% to $1,644, with a low of $1,638. On the weekly timeframe, BTC lost 4.91%, and ETH shed 6.09%, reflecting persistent bearish pressure. The 30-day decline is more pronounced, with BTC down 19.21% and ETH down 20.72%, signaling a sustained downtrend since late May. Trading volumes remain subdued relative to the 7-day average—BTC at 0.7x and ETH at 0.52x—suggesting cautious participation. RSI readings are neutral for both assets (BTC 49.4, ETH 52.5), indicating no immediate overbought or oversold extremes. Key support levels are being tested, particularly for BTC near the $61,200 area, which aligns with recent lows. The broader market narrative continues to revolve around macroeconomic headwinds and reduced risk appetite, with no clear catalyst for reversal yet.
Bitcoin Analysis
TradingView Live (4h)
Bitcoin’s price action on June 24 reflects a continuation of the bearish momentum observed over the past week. After opening near $62,700, BTC declined steadily through the Asian and early European sessions, hitting an intraday low of $61,206—just above the 30-day low of $59,131 recorded earlier this month. The session low represents a critical test of the $61,200 support zone, which has held twice in the past seven days. A break below this level could open the door to a retest of the $59,000–$60,000 range. The daily high of $63,239 was rejected early, confirming resistance near the $63,200 level, which aligns with the 7-day moving average (MA7) of $63,173. The MA30 at $65,965 remains well above the current price, indicating that the short-term trend is decisively bearish. The gap between the 7-day and 30-day moving averages is widening, a classic sign of accelerating downside momentum.
Volume is notably below average at 0.7x the 7-day norm, which suggests that the selling pressure, while persistent, is not accompanied by panic. Low volume can sometimes precede a consolidation phase or a volatile breakout. The RSI(14) at 49.4 sits squarely in neutral territory, neither oversold nor overbought. This leaves room for further downside without triggering a technical bounce signal. However, the RSI has been declining from overbought levels seen in early June, and a move below 40 would indicate strengthening bearish momentum. Key resistance levels to watch are $63,200 (MA7), $64,500 (recent swing high), and $65,965 (MA30). On the downside, support is at $61,200 (current low), $60,000 (psychological round number), and $59,131 (30-day low). The lack of volume and neutral RSI suggest the market is in a wait-and-see mode, with traders reluctant to commit until a clearer direction emerges.
Ethereum Analysis
TradingView Live (4h)
Ethereum’s performance on June 24 mirrors Bitcoin’s weakness, though with slightly less severity in the daily move (-1.39% vs. -2.22%). ETH opened near $1,670 and slid to an intraday low of $1,638, testing the lower end of its recent range. The session high of $1,694 was rejected, with resistance holding near the $1,700 psychological level. On the weekly timeframe, ETH has lost 6.09%, underperforming BTC’s 4.91% decline, which is consistent with ETH’s higher beta nature. The 30-day decline of 20.72% is also slightly worse than BTC’s 19.21%, reflecting the broader risk-off sentiment that disproportionately impacts altcoins. The 7-day moving average at $1,701 and the 30-day moving average at $1,780 are both above the current price, confirming a bearish short-term trend. The gap between these averages is also widening, similar to BTC.
Volume for ETH is notably low at 0.52x the 7-day average, indicating even weaker participation than Bitcoin. This suggests that the current price action is driven more by lack of buying interest than aggressive selling. The RSI(14) at 52.5 is slightly higher than BTC’s, but still neutral. It has declined from overbought levels in early June and is now hovering around the midpoint. A move below 50 would signal a shift toward bearish momentum. Key resistance levels are $1,700 (MA7 and psychological), $1,780 (MA30), and $1,800 (round number). On the downside, support is at $1,638 (current low), $1,600 (round number), and $1,506 (30-day low). The low volume and neutral RSI suggest that ETH may be forming a base near $1,600–$1,640, but a break below $1,600 could accelerate losses toward the 30-day low. The lack of a clear catalyst and the broader market weakness keep ETH in a precarious position.
Key Technical Levels
| Asset | Support | Resistance | RSI |
|---|---|---|---|
| BTC | $61,200, $60,000, $59,131 | $63,200, $64,500, $65,965 | Neutral (49.4) |
| ETH | $1,638, $1,600, $1,506 | $1,700, $1,780, $1,800 | Neutral (52.5) |
BTC vs ETH Dynamic
The correlation between Bitcoin and Ethereum remains high, with both assets moving in tandem during the current downtrend. Over the past 24 hours, BTC’s -2.22% move and ETH’s -1.39% move show a slight divergence, with ETH showing relative resilience. However, on the weekly and monthly timeframes, ETH has underperformed BTC, as evidenced by its larger percentage declines. This pattern is typical in bearish phases, where investors rotate into Bitcoin as a relatively safer store of value within the crypto ecosystem. The ETH/BTC ratio has declined from 0.0275 a week ago to approximately 0.0268 today, further confirming this dynamic. The neutral RSI readings for both assets suggest that the correlation may persist until one asset breaks out of its range. A decisive move in either direction by BTC is likely to lead ETH, given Bitcoin’s role as the market leader. Traders should monitor the $61,200 support for BTC and $1,638 support for ETH as key levels that could determine the next leg of the correlation.
Strategy Fit
Given the current market environment—characterized by a sustained downtrend, low volume, and neutral RSI—a conservative approach is warranted. The lack of clear momentum and the proximity to key support levels suggest that trend-following strategies may be risky, as false breakouts or reversals are possible. Grid trading, particularly on Pionex’s built-in grid bots, is well-suited for this sideways-to-slightly-bearish range. For BTC, a grid between $60,000 and $63,500 could capture volatility within the current range without requiring directional conviction. For ETH, a grid between $1,600 and $1,700 would align with the recent price action. Dollar-cost averaging (DCA) is also a viable strategy for long-term holders, as the 30-day decline of ~20% may present accumulation opportunities, but only for those with a high risk tolerance. Trend-following strategies, such as trailing stop-loss or moving average crossovers, are not recommended at this time due to the neutral RSI and low volume, which can lead to whipsaws. Pionex’s infinity grid or reverse grid bots could also be considered for more advanced users seeking to profit from range-bound volatility. In summary, the current environment favors non-directional strategies like grid trading over directional bets.
Risk Disclaimer
This market recap is for informational and educational purposes only and does not constitute financial advice, investment recommendation, or solicitation to buy or sell any digital assets. Cryptocurrency markets are highly volatile and involve substantial risk, including the potential loss of principal. Past performance is not indicative of future results. The technical analysis and levels provided are based on historical data and may not accurately predict future price movements. Readers should conduct their own research and consult with a qualified financial advisor before making any investment decisions. The author and platform assume no liability for any losses incurred as a result of using this information.
FAQ
Q: Why is Bitcoin down 19.21% in the last 30 days?
A: The decline is attributed to a combination of macroeconomic headwinds, including rising interest rate expectations, reduced risk appetite, and profit-taking after the rally earlier in the year. Technical factors, such as the breakdown below key moving averages, have also contributed to selling pressure.
Q: Is the RSI of 49.4 for Bitcoin considered bearish?
A: No, an RSI of 49.4 is neutral, meaning the asset is neither overbought nor oversold. It indicates that the selling pressure is balanced but not extreme. A move below 40 would signal bearish momentum, while above 60 would suggest bullish strength.
Q: What does low volume (0.7x for BTC) indicate?
A: Low volume relative to the 7-day average suggests reduced market participation. This can indicate indecision or a lack of conviction among traders. Low volume often precedes periods of consolidation or, occasionally, a sharp breakout in either direction.
Q: Should I consider buying Ethereum at $1,644?
A: This recap does not provide buy/sell recommendations. However, from a technical perspective, $1,638 is a key support level. A break below could lead to a test of $1,600 or lower. Traders should assess their risk tolerance and use stop-losses if entering positions.
Q: How can I use Pionex bots in this market?
A: In a range-bound market with neutral RSI, grid trading bots on Pionex can be effective. For BTC, set a grid between $60,000 and $63,500. For ETH, between $1,600 and $1,700. DCA bots can also be used for long-term accumulation. Avoid trend-following bots until a clear direction emerges.


