BTC ETH Daily Recap | 2026-07-11

BTC ETH Daily Recap | 2026-07-11
Today at a Glance
On July 11, 2026, the cryptocurrency market showed quiet consolidation with mild bullish bias across both Bitcoin and Ethereum. BTC/USDT traded at $64,264, gaining +0.16% over the past 24 hours, with a narrow intraday range of $63,984 to $64,310. The asset remains in a constructive position above its key moving averages (MA7: $63,572; MA30: $62,765), though trading volume is notably subdued at only 0.3x its 7-day average, signaling reduced market participation. Ethereum posted a slightly stronger daily performance at +0.37%, reaching $1,803, with a 24-hour range of $1,787 to $1,808. ETH’s 30-day performance stands out at +8.23%, significantly outpacing BTC’s +1.08% over the same period. Both assets are trading near the upper ends of their respective weekly ranges, with BTC’s RSI at 67.8 (approaching overbought territory) and ETH’s RSI at 76.8 (technically overbought). The reduced volume environment suggests caution, as price action may be more susceptible to abrupt moves on any catalyst.
Bitcoin Analysis
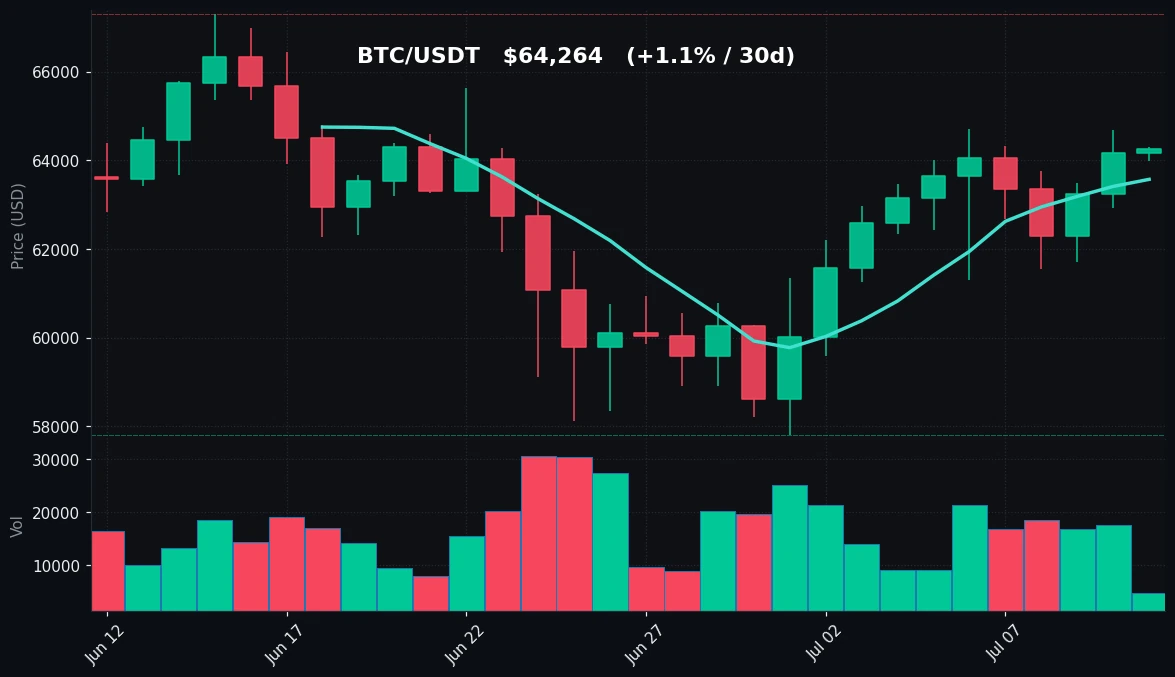
TradingView Live (4h)
Bitcoin is currently trading at $64,264, maintaining a position above both its 7-day moving average of $63,572 and its 30-day moving average of $62,765. The price action over the past week has been characterized by a gradual recovery from the July 4 low of $61,307 to the weekly high of $64,700, representing a +5.5% move. The current price sits just 0.7% below the weekly high, indicating persistent but slowing bullish momentum. The 30-day range spans from $57,800 to $67,292, placing the current price in the upper-middle portion of this broader range.
Technical indicators paint a mixed picture. The Relative Strength Index (RSI-14) at 67.8 is in bullish territory but not yet overbought, suggesting room for further upside before reaching exhaustion levels typically above 70. However, the volume profile is the most notable concern: today’s volume is only 0.3x the 7-day average, representing a significant decline in market activity. This volume compression often precedes either a breakout or a sharp reversal, as thin liquidity can amplify price moves in either direction.
Key technical levels to monitor include immediate support at the MA7 ($63,572), followed by stronger support at the MA30 ($62,765). The $61,307 weekly low serves as a critical floor. On the upside, resistance is evident at the weekly high of $64,700, with the 30-day high of $67,292 representing the next major barrier. The narrowing range between the MA7 and current price suggests that a decisive move above $64,700 could trigger short-term momentum, but the low volume warrants caution regarding the sustainability of any breakout.
Ethereum Analysis
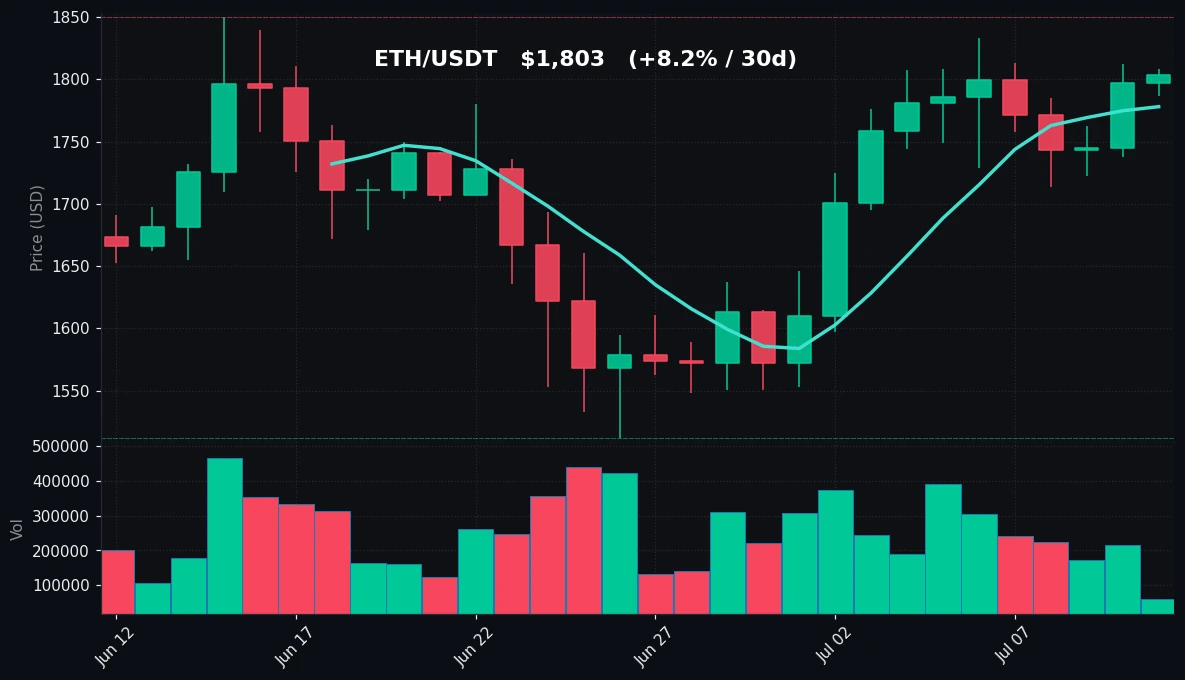
TradingView Live (4h)
Ethereum is trading at $1,803, showing a +0.37% gain over the past 24 hours. The asset has demonstrated stronger relative performance compared to Bitcoin over the past month, with a 30-day gain of +8.23% versus BTC’s +1.08%. ETH’s 7-day range of $1,713 to $1,833 places the current price near the upper end, while the 30-day range of $1,512 to $1,850 indicates that ETH is approaching its highest levels of the past month.
Technical positioning is notably more extended for ETH compared to BTC. The RSI-14 reading of 76.8 is firmly in overbought territory (above 70), which historically suggests that a short-term pullback or consolidation phase may be imminent. However, overbought conditions can persist in strong trending markets, so this alone does not signal an immediate reversal. The MA7 at $1,778 and MA30 at $1,702 are both well below the current price, confirming the bullish trend structure.
Volume conditions are even more subdued for ETH than BTC, with today’s volume at just 0.24x the 7-day average. This is a critical observation: price is near 30-day highs while volume is contracting sharply, which can indicate a lack of conviction behind the recent advance. The $1,808 intraday high represents immediate resistance, with the 30-day high of $1,850 as the next major target. Support levels are found at the MA7 ($1,778), the weekly low ($1,713), and the MA30 ($1,702). The divergence between rising price and falling volume warrants close monitoring for potential exhaustion.
Key Technical Levels
| Asset | Support | Resistance | RSI |
|---|---|---|---|
| BTC | $63,572 (MA7) / $62,765 (MA30) / $61,307 (7d low) | $64,700 (7d high) / $67,292 (30d high) | 67.8 — neutral-bullish |
| ETH | $1,778 (MA7) / $1,713 (7d low) / $1,702 (MA30) | $1,808 (24h high) / $1,833 (7d high) / $1,850 (30d high) | 76.8 — overbought |
BTC vs ETH Dynamic
The correlation between Bitcoin and Ethereum remains positive, with both assets exhibiting similar directional bias over the past 24 hours and week. However, a notable divergence is emerging in relative strength: ETH has outperformed BTC by a significant margin over the past 30 days (+8.23% vs +1.08%), suggesting capital rotation toward the second-largest cryptocurrency. This outperformance is occurring despite ETH’s higher RSI reading (76.8 vs 67.8), which could indicate stronger underlying demand or speculative interest. The volume discrepancy — with both assets seeing reduced activity but ETH’s volume compression being more extreme — adds complexity to the interpretation. If ETH’s price advance is genuine, volume should ideally confirm the move; the current lack of volume suggests the rally may be driven by thinner order books rather than broad participation. The ratio of ETH to BTC price (approximately 0.0281) is near the upper end of its recent range, and a sustained break above this level would further confirm ETH’s relative strength.
Strategy Fit
Given the current market conditions — low volatility, compressed volume, and mixed technical signals — a range-trading or grid trading strategy appears most appropriate for today’s environment. Both BTC and ETH are trading within well-defined ranges (BTC: $63,572-$64,700; ETH: $1,778-$1,833), with neither showing clear directional conviction. A grid trading bot, such as those available on Pionex, can capitalize on these oscillations by placing buy orders near support and sell orders near resistance, automatically capturing small profits from each price fluctuation. The low volume environment reduces the risk of sudden range breakouts, making grid strategies relatively safer than in high-volatility conditions.
For more conservative investors, a DCA (Dollar-Cost Averaging) approach remains viable, particularly given that both assets are trading above their 30-day moving averages, indicating a medium-term uptrend. Pionex’s DCA bot can automate regular purchases, reducing timing risk. Trend-following strategies are less suitable today due to the subdued volume and lack of strong momentum, as false signals are more likely in thin markets. Traders should set tight stop-losses if taking directional positions, as the low volume environment can amplify any sudden moves. The overbought RSI on ETH also suggests caution for new long entries without a pullback.
Risk Disclaimer
This market recap is provided for informational and educational purposes only and does not constitute financial advice, investment recommendation, or solicitation to buy or sell any digital assets. Cryptocurrency markets are highly volatile and involve substantial risk, including the potential loss of principal. Past performance and technical indicators do not guarantee future results. Readers should conduct their own independent research and consult with a qualified financial advisor before making any investment decisions. The author and platform assume no liability for any losses incurred based on the information provided herein.
FAQ
Q: Why is Bitcoin’s volume so low compared to its 7-day average?
A: Bitcoin’s current volume is only 0.3x its 7-day average, indicating reduced market participation. This often occurs during consolidation phases when traders are awaiting clearer directional signals or macroeconomic catalysts. Low volume can lead to higher price sensitivity to any news or large orders.
Q: What does an RSI of 76.8 on Ethereum mean?
A: An RSI (Relative Strength Index) above 70 is considered overbought, suggesting that ETH has risen sharply and may be due for a pullback or consolidation. However, in strong trending markets, overbought conditions can persist. The reading should be interpreted alongside volume and price action for a complete picture.
Q: Should I buy Ethereum now since it’s outperforming Bitcoin?
A: This analysis does not provide buy or sell recommendations. While ETH has outperformed BTC over the past 30 days (+8.23% vs +1.08%), its overbought RSI and declining volume suggest caution. Any investment decision should be based on your own risk tolerance and research.
Q: What are the key support and resistance levels for Bitcoin?
A: For BTC, key support levels are $63,572 (7-day moving average), $62,765 (30-day moving average), and $61,307 (7-day low). Key resistance levels are $64,700 (7-day high) and $67,292 (30-day high). A break above $64,700 could target the 30-day high.
Q: How can I trade in this low-volatility environment?
A: Low volatility environments are well-suited for grid trading strategies, which profit from price oscillations within a range. Pionex offers grid trading bots that automatically place buy and sell orders at predefined levels. Dollar-cost averaging (DCA) is also appropriate for long-term accumulation. Trend-following strategies are less recommended due to the risk of false breakouts.


