BTC ETH Daily Recap – 2026-07-15

BTC ETH Daily Recap – 2026-07-15
Today at a Glance
On July 15, 2026, the cryptocurrency market showed mixed but constructive action, with Bitcoin consolidating near recent highs while Ethereum outperformed sharply. Bitcoin (BTC) traded at $65,242, up +0.30% in the last 24 hours, with a daily range of $64,485 to $65,577. The asset is now up +4.74% over the past seven days, though it remains -0.66% lower over the trailing 30 days. Ethereum (ETH) displayed stronger momentum, climbing +1.92% on the day to $1,928, with a 7-day gain of +10.60% and a 30-day advance of +7.54%. ETH’s daily high of $1,947 matched its 30-day peak, signaling a breakout attempt. Volume for BTC was notably subdued at 0.66x the 7-day average, while ETH saw more typical participation at 0.9x. Both assets are trading above their respective 7-day and 30-day moving averages, with ETH’s RSI entering overbought territory at 81.3, while BTC’s RSI sits at a more moderate 71.1.
Bitcoin Analysis
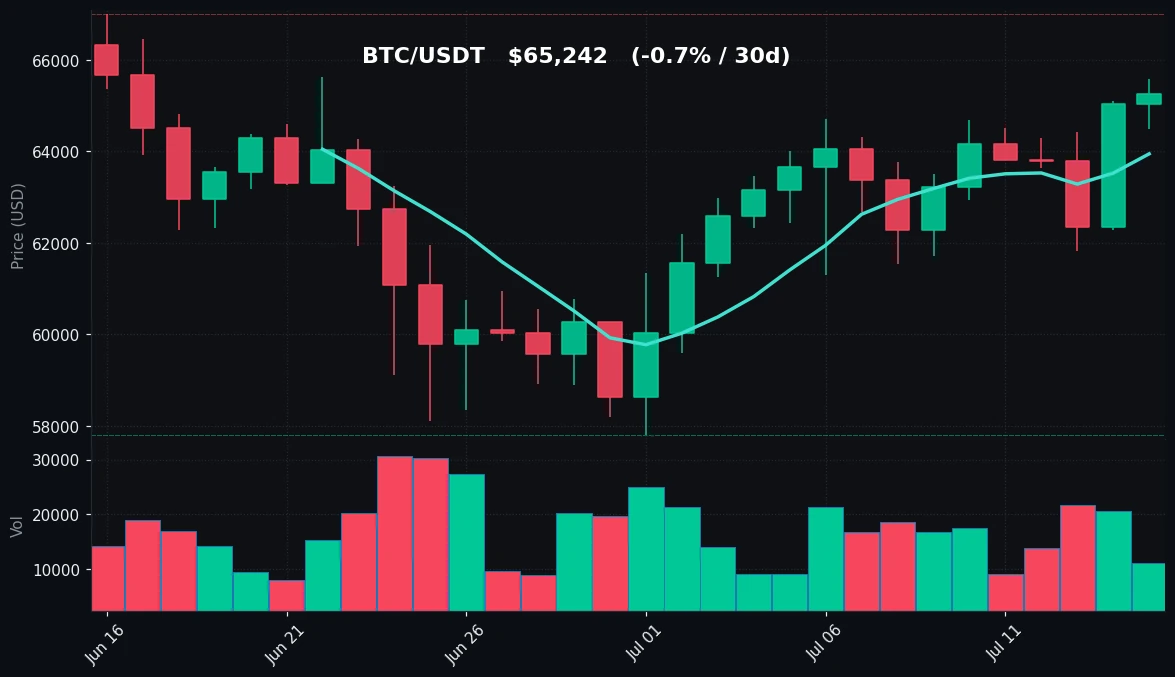
TradingView Live (4h)
Bitcoin’s price action on July 15 reflects a period of consolidation after a strong weekly rally. The asset closed the day near $65,242, slightly below its 24-hour high of $65,577, which also marks the 7-day high. The intraday low of $64,485 held above the 7-day moving average (MA7) of $63,944, confirming short-term bullish structure. The 30-day moving average (MA30) at $62,626 continues to provide a solid floor, and BTC has not closed below this level since late June.
From a technical perspective, BTC is trading in a well-defined upward channel over the past week, with higher lows forming from $61,705 (7-day low) to the current $64,485 support area. The key resistance zone lies between $65,577 and the 30-day high of $66,992. A break above $66,000 would open the path toward the psychological $67,000 level. On the downside, immediate support sits at $64,000 (round number and near MA7), followed by $62,600 (MA30) and $61,700 (7-day low).
Volume analysis reveals a notable decline: BTC’s 24-hour trading volume is only 0.66x the 7-day average, suggesting reduced participation during the consolidation phase. This volume contraction often precedes a directional move, but the lack of conviction on the breakout attempt above $65,500 is a cautionary signal. The RSI(14) reading of 71.1 indicates the asset is approaching overbought territory but has not yet reached extreme levels. Historically, BTC’s RSI above 70 can persist during strong uptrends, but the declining volume warrants close monitoring.
The price structure remains bullish as long as BTC holds above MA7 and MA30. The convergence of these moving averages (MA7 at $63,944 and MA30 at $62,626) creates a support cluster that bulls will defend. No prediction is made, but the current technical setup favors trend continuation if volume picks up above $65,500.
Ethereum Analysis
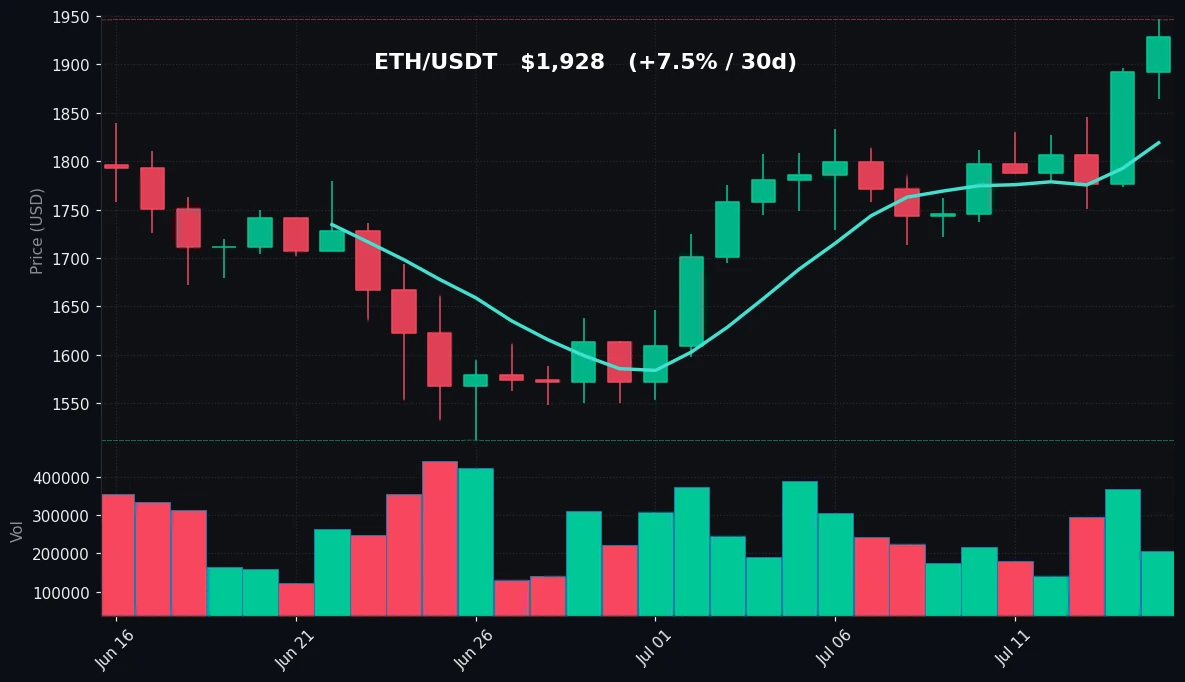
TradingView Live (4h)
Ethereum delivered the standout performance on July 15, gaining +1.92% to reach $1,928, its highest level in 30 days. The daily high of $1,947 matches the 30-day high, confirming that ETH is testing a critical resistance zone. The intraday low of $1,864 held well above the MA7 of $1,819, which itself is now above the MA30 of $1,720, a classic bullish moving average alignment.
The 7-day performance of +10.60% significantly outpaces Bitcoin’s +4.74%, reflecting a shift in market leadership toward altcoins. Over the past month, ETH has gained +7.54% while BTC has declined -0.66%, further underscoring relative strength. The 7-day low of $1,722 and 30-day low of $1,512 represent key support levels that have held during recent pullbacks.
Technical indicators for ETH are flashing overbought signals. The RSI(14) stands at 81.3, firmly above the 70 threshold, indicating that buying pressure has been intense over the past two weeks. While overbought conditions can persist in strong trends, they often precede a short-term pullback or consolidation. Volume at 0.9x the 7-day average is more robust than BTC’s, but still below the elevated levels seen during the initial rally from $1,512.
The immediate resistance is the $1,947 level (30-day high), with a breakout above $1,950 targeting the $2,000 psychological barrier. On the downside, the first support is $1,864 (today’s low), followed by $1,819 (MA7) and $1,720 (MA30). The MA30 has acted as reliable support since mid-June, and any pullback toward this level would be considered healthy within an uptrend.
The volume profile suggests that ETH’s rally is driven by genuine accumulation, but the overbought RSI and proximity to resistance create a tug-of-war. Traders should watch for a daily close above $1,950 to confirm the breakout, or a decline below $1,864 to signal a short-term top.
Key Technical Levels
| Asset | Support | Resistance | RSI |
|---|---|---|---|
| BTC | $64,000 / $62,626 | $65,577 / $66,992 | 71.1 (approaching overbought) |
| ETH | $1,864 / $1,819 | $1,947 / $2,000 | 81.3 (overbought) |
BTC vs ETH Dynamic
The correlation between Bitcoin and Ethereum remains positive, but the magnitude of ETH’s outperformance is notable. Over the past seven days, ETH has gained more than double BTC’s return, and over the past month, ETH is up while BTC is down. This divergence suggests that capital is rotating from Bitcoin into Ethereum, possibly in anticipation of network upgrades or sector-specific catalysts. The ETH/BTC ratio has risen from 0.029 on July 8 to 0.0295 on July 15, a modest but persistent increase. Historically, such periods of ETH outperformance precede broader altcoin rallies, but they also increase the risk of a correction if Bitcoin fails to hold support. The current dynamic favors a “risk-on” posture within the crypto market, with Ethereum leading the charge.
Strategy Fit
Based on current volatility and trend conditions, the market is best suited for trend-following and DCA (dollar-cost averaging) strategies. Bitcoin’s consolidation with declining volume suggests that a breakout or breakdown is pending, making grid trading less ideal in the short term due to range uncertainty. For Ethereum, the overbought RSI and proximity to resistance argue against aggressive new entries, but a DCA approach can capture long-term upside while mitigating timing risk.
For traders using Pionex’s built-in bots, the following strategies fit the current environment:
- Trend Following Bot: Suitable for ETH given its strong upward momentum. The bot can be set to buy on pullbacks to MA7 ($1,819) and sell at resistance ($1,947-$2,000).
- DCA Bot: Ideal for BTC during consolidation. Regular buys at current levels around $65,000 can lower average entry costs over time.
- Grid Trading Bot: Less recommended today due to low volume and tight ranges. However, a narrow grid between $64,000 and $66,000 for BTC could capture small fluctuations.
The key is to match strategy to asset behavior: trend-following for ETH, DCA for BTC, and avoid grid until volatility picks up.
Risk Disclaimer
This market recap is for informational and educational purposes only. It does not constitute financial advice, investment recommendations, or solicitation to buy or sell any assets. Cryptocurrency trading involves substantial risk of loss and is not suitable for all investors. Past performance is not indicative of future results. Always conduct your own research and consult with a qualified financial advisor before making investment decisions.
FAQ
Q: Why is Ethereum outperforming Bitcoin today?
A: Ethereum’s +1.92% daily gain versus Bitcoin’s +0.30% reflects a rotation of capital into altcoins. ETH’s price is testing its 30-day high of $1,947, supported by stronger volume (0.9x vs 0.66x for BTC) and a bullish moving average crossover (MA7 above MA30).
Q: Is Bitcoin’s RSI of 71.1 a sell signal?
A: Not necessarily. RSI above 70 indicates overbought conditions, but in strong uptrends, it can remain elevated for extended periods. The key is to watch for a bearish divergence (higher price, lower RSI) or a breakdown below support ($64,000) as confirmation of weakness.
Q: What are the key levels to watch for ETH tomorrow?
A: The immediate resistance is $1,947 (30-day high). A daily close above this level targets $2,000. On the downside, $1,864 (today’s low) and $1,819 (MA7) are key supports. A break below $1,819 would signal a short-term pullback.
Q: How does low volume affect Bitcoin’s price action?
A: Low volume (0.66x 7-day average) suggests reduced participation and indecision. It can precede a sharp move in either direction. Bulls want to see volume increase on a breakout above $65,577, while a volume spike on a breakdown below $64,000 would be bearish.
Q: What strategy is best for the current market conditions?
A: Trend-following strategies work well for Ethereum given its momentum. Dollar-cost averaging (DCA) is suitable for Bitcoin during consolidation. Avoid grid trading until volatility increases. Pionex offers automated bots for both trend-following and DCA strategies.


