BTC ETH Daily Recap – 2026-07-23

BTC ETH Daily Recap – 2026-07-23
Today at a Glance
The crypto market saw a modest pullback on July 23, 2026, with both Bitcoin and Ethereum recording losses of approximately 1.8% over the past 24 hours. Bitcoin (BTC) traded at $64,880, down from a daily high of $66,313, while Ethereum (ETH) settled at $1,899 after touching $1,942 intraday. Despite the short-term dip, both assets remain in positive territory over the past week and month. BTC is up 1.64% over seven days and 6.22% over thirty days, while ETH has gained 1.86% weekly and an impressive 17.09% monthly. Trading volumes have dropped significantly, running at roughly half the 7-day average for both assets, indicating reduced market participation. The Relative Strength Index (RSI) readings suggest BTC is in neutral territory at 57.3, while ETH sits at 67.0, approaching overbought conditions. The 30-day moving averages continue to slope upward, supporting a broader bullish structure despite today's softness.
Bitcoin Analysis
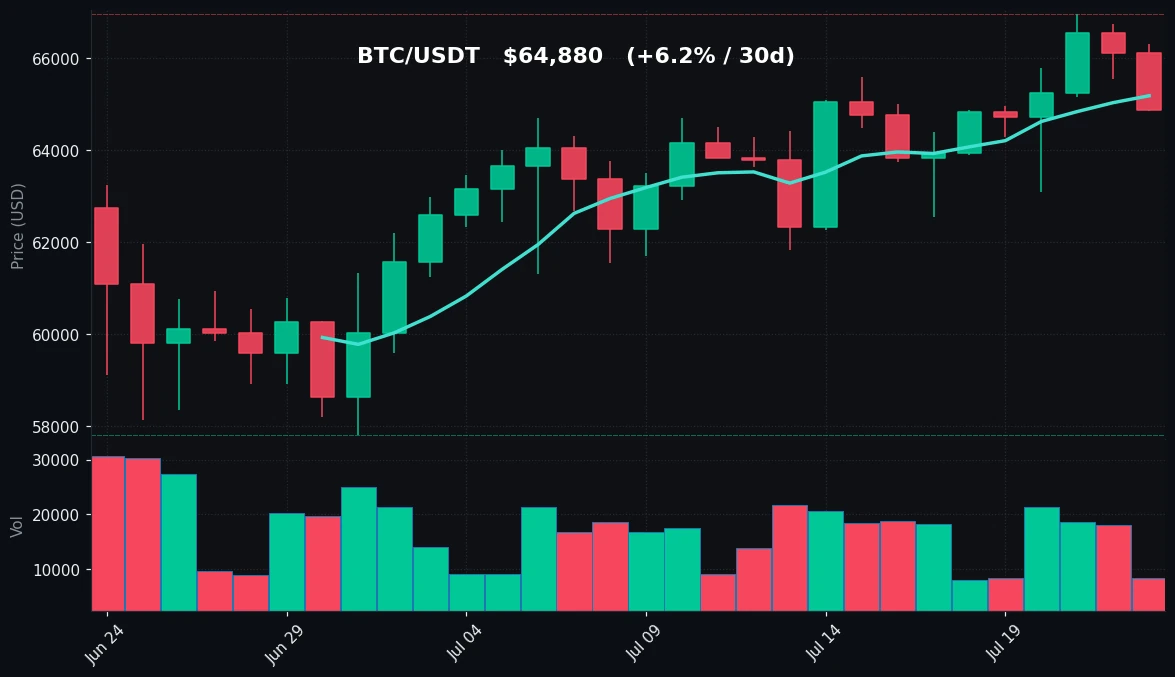
TradingView Live (4h)
Bitcoin's price action on July 23 reflects a continuation of the consolidation pattern observed over the past week. After reaching a 7-day high of $66,956, BTC has receded to test support near the $64,800–$65,000 zone. The current price of $64,880 sits just below the 7-day moving average of $65,185, suggesting short-term bearish pressure. However, the 30-day moving average at $62,912 remains well below current levels, indicating the medium-term trend is still intact.
The 24-hour range of $64,864 to $66,313 shows a narrow trading band, typical of low-volatility environments. Volume is notably subdued at 0.52x the 7-day average, confirming that the pullback is occurring on low participation. This lack of conviction in either direction often precedes a breakout, but the direction remains uncertain.
From a technical perspective, the RSI(14) reading of 57.3 places BTC firmly in neutral territory, neither overbought nor oversold. This leaves room for movement in either direction without immediate exhaustion signals. The 30-day low of $57,800 and the 30-day high of $66,956 define a broad range that BTC has been navigating. The recent bounce from the $62,538 7-day low suggests buyers are stepping in at lower levels, but the failure to hold above the 7-day MA indicates sellers are also active near resistance.
Key support levels to watch include the $62,900 area (30-day MA) and the $62,538 7-day low. A break below these could open the path toward the $60,000 psychological level. On the upside, resistance at $66,300 (today's high) and $66,956 (7-day high) must be cleared for a resumption of the uptrend. The volume profile suggests that any significant move will require a catalyst, as current market participation is insufficient to sustain strong trends.
Ethereum Analysis
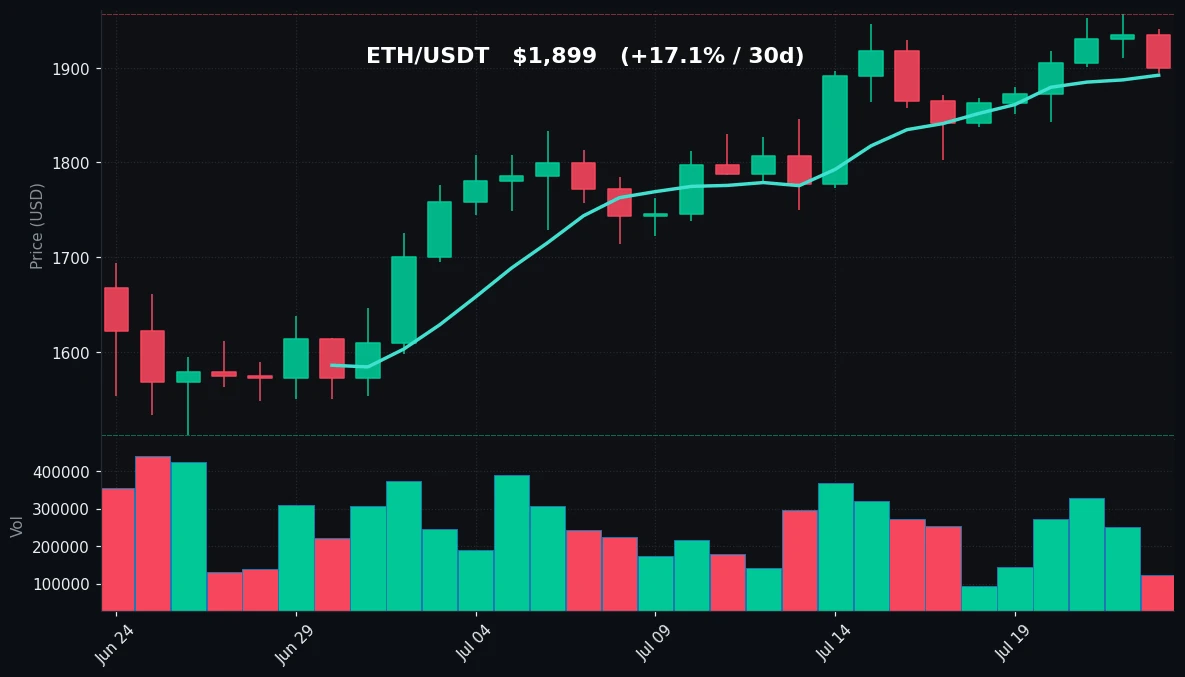
TradingView Live (4h)
Ethereum's price action mirrors Bitcoin's but with slightly stronger relative performance over the medium term. At $1,899, ETH is down 1.80% on the day but remains above its 7-day moving average of $1,892. The 30-day moving average at $1,763 is well below the current price, confirming a bullish medium-term trend. The 30-day gain of 17.09% significantly outpaces Bitcoin's 6.22%, highlighting ETH's recent outperformance.
The intraday range of $1,894 to $1,942 is tight, and volume at 0.53x the 7-day average mirrors the low participation seen in BTC. The 7-day high of $1,956 and 30-day high of $1,956 are identical, suggesting that ETH has been testing resistance at this level repeatedly without breaking through. The 30-day low of $1,512 provides a stark contrast, emphasizing the magnitude of the recent rally.
The RSI(14) reading of 67.0 is a key observation. This level is approaching the overbought threshold of 70, indicating that ETH's recent upward momentum may be losing steam. While not yet in overbought territory, the RSI suggests that buyers are becoming fatigued and a pullback or consolidation phase could be imminent. This is consistent with today's price decline.
Support levels for ETH include the 7-day MA at $1,892 (already tested today), the 7-day low of $1,803, and the 30-day MA at $1,763. Resistance is clearly defined at $1,956 (7-day and 30-day high) and the psychological $2,000 level. The tight range between $1,892 and $1,956 suggests a compression pattern that often precedes a significant move. Given the elevated RSI, the bias is slightly toward a downward resolution, but the low volume makes any directional bet uncertain.
Key Technical Levels
| Asset | Support | Resistance | RSI |
|---|---|---|---|
| BTC | $62,912 (MA30) / $62,538 (7d low) | $66,313 (24h high) / $66,956 (7d high) | 57.3 – Neutral |
| ETH | $1,892 (MA7) / $1,803 (7d low) | $1,942 (24h high) / $1,956 (7d high) | 67.0 – Approaching overbought |
BTC vs ETH Dynamic
The correlation between Bitcoin and Ethereum remains strong, with both assets exhibiting nearly identical 24-hour percentage declines (-1.87% vs -1.80%) and similar volume profiles. However, Ethereum's superior 30-day performance (+17.09% vs +6.22%) indicates a notable divergence in momentum. This suggests that capital rotation from BTC to ETH may have occurred during the recent rally, a pattern often seen when altcoins begin to outperform the market leader. The RSI differential (57.3 for BTC vs 67.0 for ETH) further highlights this divergence, with ETH appearing more extended relative to its recent price action. If ETH's RSI continues to climb toward 70, it may signal a short-term top, potentially dragging BTC lower as well. Conversely, a consolidation in ETH could provide support for BTC to play catch-up.
Strategy Fit
The current market environment, characterized by low volatility, declining volume, and neutral-to-elevated RSI readings, favors range-bound trading strategies over directional bets. For BTC, with the RSI at 57.3 and price oscillating between $62,500 and $67,000, a grid trading strategy is well-suited. Platforms like Pionex offer automated grid bots that can profit from these oscillations by buying low and selling high within a defined range. The low volume environment reduces the risk of sudden breakouts that could break the grid, making it a lower-risk approach.
For ETH, the RSI at 67.0 and proximity to resistance at $1,956 suggest that a DCA (Dollar-Cost Averaging) strategy may be appropriate for those looking to accumulate. The elevated RSI warns against chasing price, so staggered buys on dips toward support levels ($1,803 or $1,763) could provide better entries. Pionex's DCA bot allows users to automate this process with customizable intervals and amounts.
For more aggressive traders, a trend-following strategy is less advisable given the low volume and neutral RSI readings. However, if volume picks up and BTC breaks above $67,000 or ETH clears $1,956, a trend bot could be activated to capture the momentum. Pionex's infinity grid bot can also be used to follow trends while maintaining some range-bound exposure.
Risk Disclaimer
This market recap is for informational and educational purposes only and does not constitute financial advice, investment recommendation, or solicitation to buy or sell any digital assets. Cryptocurrency markets are highly volatile and involve substantial risk of loss. Past performance is not indicative of future results. The technical levels and analysis presented are based on historical data and may not accurately predict future price movements. You should conduct your own research and consult with a qualified financial advisor before making any investment decisions. The author and platform assume no liability for any losses incurred from the use of this information.
FAQ
Q: Why did Bitcoin and Ethereum drop today despite positive weekly performance?
A: The 1.8% decline on July 23 appears to be a normal pullback within an uptrend, not a reversal. Both assets are still up over the past week and month. The drop occurred on low volume (0.52x and 0.53x of 7-day average), suggesting it was driven by profit-taking rather than panic selling. The neutral RSI for BTC (57.3) and near-overbought RSI for ETH (67.0) indicate the move was technically expected after recent gains.
Q: What does the low volume mean for market direction?
A: Low volume typically indicates indecision and reduced conviction among traders. It often precedes a period of consolidation or a breakout when volume returns. Currently, neither buyers nor sellers are dominant, so the market may remain range-bound until a catalyst emerges. Traders should watch for volume spikes as confirmation of any directional move.
Q: Is Ethereum's RSI at 67.0 a sell signal?
A: Not necessarily. An RSI above 70 is considered overbought, while below 30 is oversold. At 67.0, ETH is approaching overbought territory but is not yet there. This suggests caution, as further upside may be limited in the short term, but it does not guarantee a reversal. The RSI can remain elevated during strong trends, so it should be used in conjunction with other indicators like volume and support/resistance levels.
Q: How do the moving averages support the current trend?
A: For BTC, the 30-day MA ($62,912) is above the 30-day low ($57,800) and sloping upward, confirming a medium-term uptrend. The 7-day MA ($65,185) is just above current price, indicating short-term weakness. For ETH, both the 7-day MA ($1,892) and 30-day MA ($1,763) are below the current price, confirming a stronger uptrend. The widening gap between the two MAs suggests momentum is building.
Q: What is the best trading strategy for this market?
A: Given the low volatility and neutral RSI readings, grid trading or DCA strategies are most appropriate. Grid trading profits from range-bound price action, while DCA reduces the risk of poor entry timing. Trend-following strategies are less favorable until volume increases and clear breakouts occur. Platforms like Pionex offer automated bots for all three strategies, allowing users to execute these approaches without constant monitoring.


