BTC ETH Daily Recap – July 17, 2026

BTC ETH Daily Recap – July 17, 2026
Today at a Glance
The crypto market opened the session on July 17 with a cautious tone, as both Bitcoin and Ethereum showed mixed short-term performance. Bitcoin traded at $63,226, down 0.95% over the past 24 hours, with a daily high of $64,068 and a low of $62,538. The asset remains in a consolidation phase, oscillating within a narrow range below the 7-day moving average of $63,827. Volume contracted to 0.67x the 7-day average, signaling reduced trader participation and indecision. Over the past week, BTC declined 1.46%, though its 30-day performance remains slightly positive at +0.43%. Ethereum, meanwhile, displayed relative strength, trading at $1,826 with a 24-hour loss of 2.07% but a 7-day gain of +1.63% and a 30-day gain of +6.72%. ETH’s RSI of 57.7 sits above BTC’s 52.8, indicating slightly more bullish momentum. The ETH/BTC ratio edged higher, reflecting capital rotation into the second-largest asset. Overall, the market is characterized by low volatility and declining volumes, suggesting a wait-and-see approach from participants ahead of potential macro catalysts.
Bitcoin Analysis
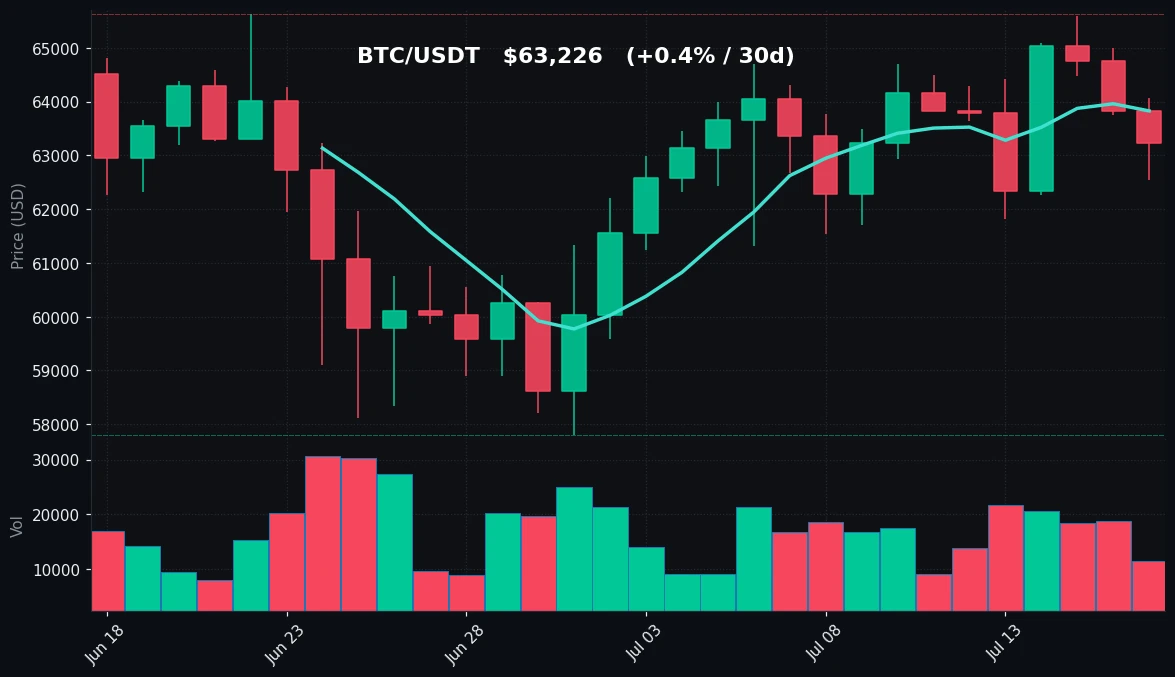
TradingView Live (4h)
Bitcoin’s price action on July 17 reflects a market grappling with resistance near the $64,000 zone and support around the $62,500 area. The asset opened near $63,800 and declined through the session, closing at $63,226. The daily candle shows a bearish bias, with the high of $64,068 failing to breach the 7-day moving average of $63,827, which now acts as dynamic resistance. The low of $62,538 held above the 30-day moving average of $62,506, a critical support level that has provided stability over the past month. The 30-day MA has been sloping upward since mid-June, suggesting a gradual recovery from the $57,800 low seen on June 17. However, the 7-day MA is now trending downward, crossing below the 30-day MA, a short-term bearish signal that indicates weakening momentum.
Volume analysis reveals a notable decline in participation. The current volume is 0.67x the 7-day average, pointing to a lack of conviction among buyers and sellers alike. This volume contraction often precedes a breakout or breakdown, as reduced liquidity can amplify price moves. The RSI(14) at 52.8 sits in neutral territory, neither overbought nor oversold, confirming the absence of strong directional bias. The 7-day high of $65,600 and low of $61,825 define the recent trading range, with the $65,600 level representing a key resistance that has been tested multiple times over the past week. On the downside, $61,825 serves as the immediate support, with a break below exposing the $60,000 psychological level and the 30-day low of $57,800.
The lack of volume and neutral RSI suggest that Bitcoin is in a consolidation phase, with traders awaiting a catalyst to break the range. The 30-day MA at $62,506 is a critical support; a close below this level would signal a shift in short-term trend from neutral to bearish. Conversely, a volume-backed move above $64,068 and the 7-day MA would open the path to retest the $65,600 resistance. For now, the market remains range-bound, with technical indicators pointing to indecision rather than a clear directional bias.
Ethereum Analysis
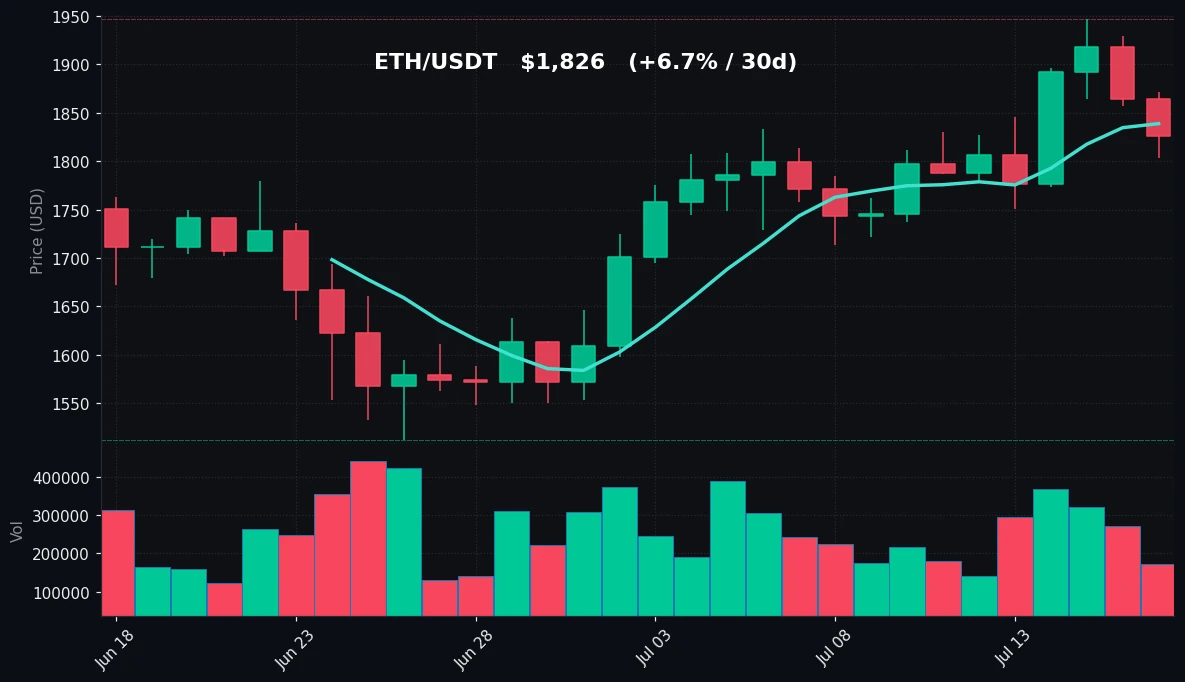
TradingView Live (4h)
Ethereum’s price action on July 17 shows a slight pullback after a period of relative outperformance. The asset traded at $1,826, down 2.07% from the previous close, with a daily high of $1,871 and a low of $1,803. Despite the 24-hour decline, ETH’s broader structure remains constructive. The 7-day moving average at $1,839 is slightly above the current price, indicating short-term weakness, but the 30-day moving average at $1,724 is well below, confirming a medium-term uptrend. The 7-day gain of +1.63% and 30-day gain of +6.72% highlight ETH’s resilience relative to BTC, which has seen a 7-day loss.
The 7-day high of $1,947, reached on July 10, marks a key resistance level that has yet to be retested. The low of $1,750 during the same period provided strong support, and the asset has since bounced to trade above the $1,800 handle. The 30-day low of $1,512, recorded on June 18, underscores the substantial recovery over the past month. The RSI(14) at 57.7 is in bullish territory but not overbought, suggesting room for further upside before reaching extreme levels. Volume, however, is a concern: the current volume is 0.67x the 7-day average, mirroring Bitcoin’s decline in activity. This low volume on a pullback day is less alarming than a high-volume sell-off, as it may indicate profit-taking rather than aggressive distribution.
The key technical levels to watch are the $1,803 intraday low, which aligns with the $1,800 psychological support, and the $1,750 level from the 7-day range. A break below $1,750 would challenge the 30-day MA at $1,724, a critical support that has held since late June. On the upside, reclaiming the $1,839 7-day MA is the first step toward a retest of $1,871 and eventually the $1,947 high. The relative strength of ETH compared to BTC is evident in the RSI differential and the positive 7-day and 30-day performance. This suggests that capital may be rotating into ETH, possibly in anticipation of network upgrades or DeFi activity. However, the low volume environment warrants caution, as sustained momentum requires participation.
Key Technical Levels
| Asset | Support | Resistance | RSI |
|---|---|---|---|
| BTC | $62,506 (MA30) / $61,825 (7d low) | $63,827 (MA7) / $64,068 (24h high) / $65,600 (7d high) | 52.8 – Neutral |
| ETH | $1,803 (24h low) / $1,750 (7d low) / $1,724 (MA30) | $1,839 (MA7) / $1,871 (24h high) / $1,947 (7d high) | 57.7 – Neutral to slightly bullish |
BTC vs ETH Dynamic
The relationship between Bitcoin and Ethereum on July 17 shows a divergence in short-term performance. While BTC posted a 24-hour decline of 0.95% and a 7-day loss of 1.46%, ETH fell 2.07% in 24 hours but maintained a 7-day gain of 1.63%. This divergence is reflected in the ETH/BTC ratio, which has edged higher over the past week, indicating that ETH is outperforming BTC on a relative basis. The 30-day performance gap is even more pronounced: ETH is up 6.72% versus BTC’s 0.43%, suggesting a sustained rotation into altcoins. Correlation between the two assets remains high, as both experienced volume contraction and similar intraday patterns, but the momentum differential is notable. BTC’s neutral RSI of 52.8 versus ETH’s 57.7 confirms that ETH has stronger short-term momentum. This dynamic often occurs when the market is in a consolidation phase for BTC, with traders seeking higher-beta opportunities in ETH. If BTC breaks above resistance, ETH is likely to follow with amplified moves; conversely, a breakdown in BTC could see ETH underperform due to its higher volatility profile.
Strategy Fit
Given the current market conditions—low volume, neutral RSI readings, and range-bound price action—the optimal strategy for July 17 is a range-bound or mean-reversion approach. Both BTC and ETH are trading within well-defined support and resistance zones, with BTC between $62,500 and $64,000, and ETH between $1,800 and $1,870. This environment is ideal for grid trading bots, which profit from price oscillations within a set range. Pionex’s built-in Grid Trading Bot can be configured with a range of $61,800 to $64,200 for BTC and $1,750 to $1,900 for ETH, capturing profits on each small fluctuation. The low volume reduces the risk of sudden breakouts, making grid strategies safer than trend-following approaches.
For traders with a longer horizon, Dollar-Cost Averaging (DCA) remains a prudent strategy, especially given the 30-day uptrend in ETH and the neutral stance of BTC. Pionex’s DCA bot allows for automated accumulation at regular intervals, reducing the impact of short-term volatility. Trend-following strategies are not recommended in the current environment, as the lack of volume and neutral RSI do not support a clear directional bias. If volatility picks up, a breakout strategy with stop-losses at the support levels mentioned above could be considered. For now, patience and range-bound tactics are most appropriate.
Risk Disclaimer
This market recap is for informational and educational purposes only and does not constitute financial advice, investment recommendation, or solicitation to buy or sell any digital assets. Cryptocurrency markets are highly volatile and involve substantial risk of loss. Past performance is not indicative of future results. All trading decisions should be made based on your own research and risk tolerance. Consult with a qualified financial advisor before engaging in any trading activity. The author and platform are not responsible for any losses incurred.
FAQ
Q1: Why did Bitcoin’s volume drop to 0.67x the 7-day average?
A1: Volume contraction often occurs during consolidation phases when traders are uncertain about the next direction. On July 17, reduced participation reflects a wait-and-see attitude ahead of potential macro events or technical breakouts. Low volume can precede increased volatility, so traders should monitor for a volume spike.
Q2: What does an RSI of 52.8 for BTC indicate?
A2: An RSI of 52.8 is neutral, meaning Bitcoin is neither overbought (above 70) nor oversold (below 30). This suggests that the market is in equilibrium, with no strong momentum in either direction. It aligns with the current range-bound price action.
Q3: Is Ethereum’s outperformance over Bitcoin sustainable?
A3: Ethereum’s 30-day gain of 6.72% versus BTC’s 0.43% indicates a rotation into ETH, possibly driven by network fundamentals or DeFi activity. However, sustainability depends on volume and macro factors. The low volume on July 17 suggests caution, as outperformance may be temporary without broader market participation.
Q4: What are the key support levels for BTC and ETH to watch?
A4: For BTC, the 30-day moving average at $62,506 and the 7-day low of $61,825 are critical supports. For ETH, the $1,800 psychological level and the 7-day low of $1,750 are key. A break below these levels could signal a trend change.
Q5: How can I use Pionex bots in the current market?
A5: In a range-bound market like today, Pionex’s Grid Trading Bot is ideal for capturing profits from price oscillations. Set a grid range based on support and resistance levels. For DCA, use the bot to accumulate gradually during dips. Avoid trend-following bots until a clear breakout with volume confirms direction.


