BTC ETH Daily Recap – 2026-07-30

BTC ETH Daily Recap – 2026-07-30
Today at a Glance
Bitcoin and Ethereum both advanced on July 30, 2026, with BTC gaining 1.55% to settle at $64,974, while ETH rose 0.91% to $1,928. BTC’s intraday range spanned $63,604 to $65,177, showing a clear rejection near the $65,200 resistance zone. The 7-day performance remains mixed: BTC is slightly negative (-0.19%) over the past week, while ETH has added 2.65%, reflecting continued relative strength in altcoins. Over the past 30 days, BTC is up 8.25%, while ETH has surged 19.80%, nearly doubling BTC’s return. Volume on both assets declined relative to their 7-day averages, with BTC at 0.92x and ETH at 0.49x, suggesting cautious participation. The RSI readings of 56.0 (BTC) and 57.9 (ETH) sit in neutral territory, leaving room for further upside without immediate overbought risk. Key short-term moving averages are acting as dynamic support, with BTC trading above both its MA7 ($64,363) and MA30 ($63,956), and ETH above its MA7 ($1,906) and MA30 ($1,837). The market appears to be consolidating after the strong July rally, with both assets respecting upward-sloping trendlines.
Bitcoin Analysis
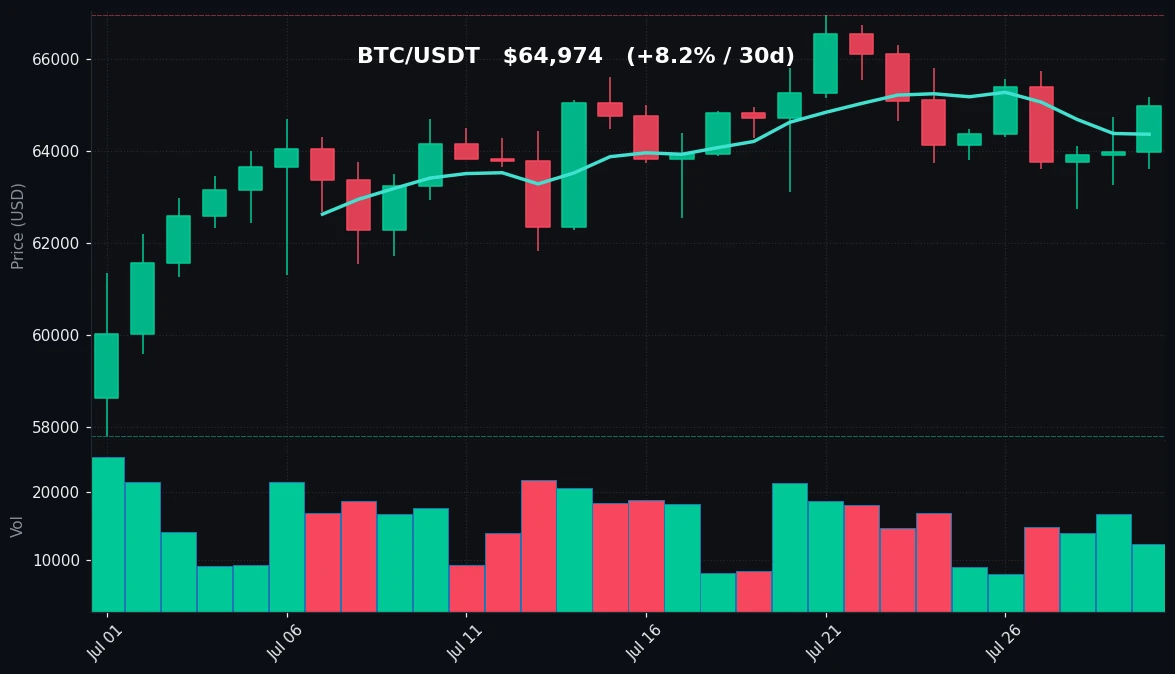
TradingView Live (4h)
Bitcoin’s price action on July 30 reflects a continuation of the tight consolidation that has characterized the past week. After touching a 7-day low of $62,742 on July 24, BTC recovered to test the $65,809 high on July 28, but has since settled into a narrowing range between $63,600 and $65,200. The current price of $64,974 sits just below the intraday high of $65,177, indicating that buyers are attempting to push through the $65,200–$65,800 resistance zone. The 24-hour range of $63,604 to $65,177 is relatively wide (approximately 2.5%), suggesting that intraday volatility remains elevated despite the overall consolidation.
From a technical perspective, Bitcoin is trading above both its 7-day moving average ($64,363) and its 30-day moving average ($63,956), a configuration that typically favors bullish momentum. The MA7 is sloping upward, while the MA30 continues to rise from the $57,800 low on the 30-day chart. The gap between these two averages is widening, which can be interpreted as a strengthening of the short-term trend. However, the price is still below the 30-day high of $66,956, indicating that the broader uptrend has not yet been confirmed with a new high.
Volume on July 30 is 0.92x the 7-day average, which is slightly below average. This lack of volume conviction near resistance suggests that the market is waiting for a catalyst. The RSI(14) of 56.0 is neutral, neither overbought nor oversold, which leaves room for either direction. A move above 60 would signal increasing bullish momentum, while a drop below 50 would indicate weakening.
The key support level to watch is the MA7 at $64,363, followed by the $63,600 area (today’s low). A break below $62,742 (7-day low) would invalidate the short-term bullish structure. On the upside, a clean break above $65,809 (7-day high) would target the $66,956 (30-day high) resistance. The lack of volume suggests that the market may continue to range until a catalyst emerges.
Ethereum Analysis
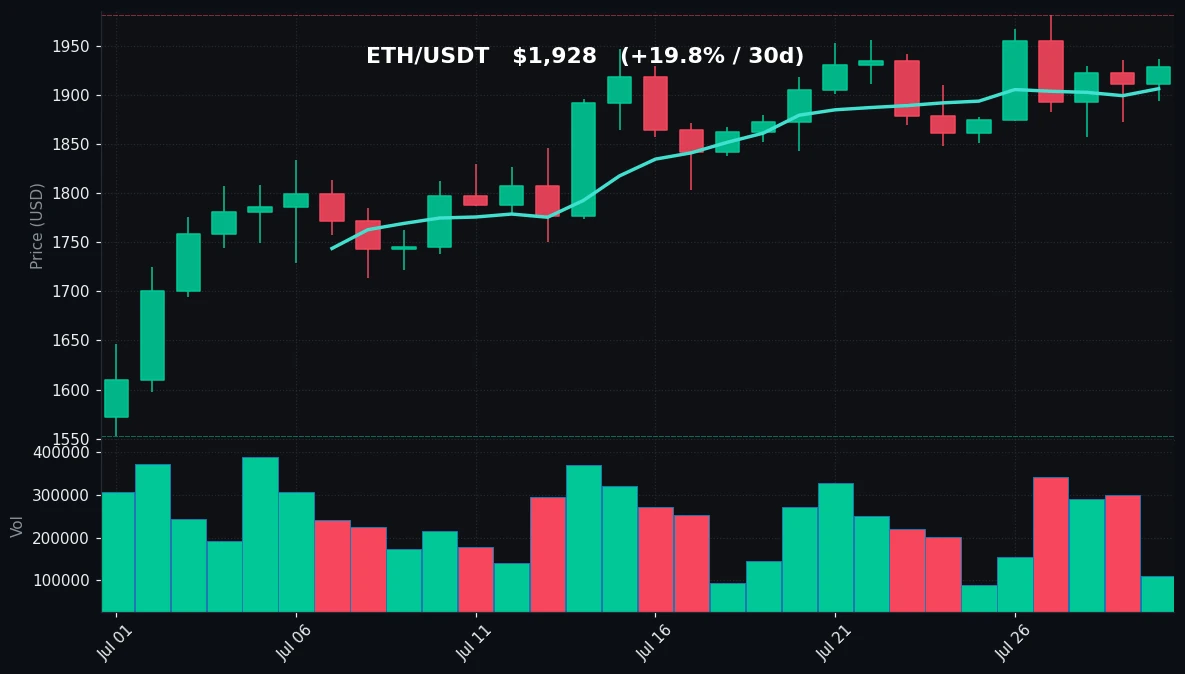
TradingView Live (4h)
Ethereum’s price action on July 30 shows a more subdued performance compared to Bitcoin, with a 0.91% gain to $1,928. The intraday range of $1,894 to $1,937 is relatively narrow (2.3%), indicating that ETH is also consolidating after a strong July. The 7-day performance of +2.65% outperforms BTC, and the 30-day return of +19.80% is significantly stronger, reflecting capital rotation into altcoins during the month.
ETH is trading above both its MA7 ($1,906) and MA30 ($1,837), confirming an upward trend. The MA7 is sloping upward and has crossed above the MA30, a classic golden cross signal that occurred earlier in July. This configuration typically supports further upside. The price is currently testing the $1,937–$1,981 resistance zone, which represents the 7-day high area. The 30-day high of $1,981 is the next major resistance level.
Volume on ETH is notably low at 0.49x the 7-day average, indicating a significant drop in trading activity. This is a bearish divergence: price is near resistance but volume is declining. Low volume near resistance often precedes a pullback. The RSI(14) of 57.9 is slightly higher than BTC’s 56.0 but still in neutral territory. ETH’s RSI has been trending higher from oversold levels near 30 on the 30-day chart, suggesting that the momentum is still positive but not overextended.
Key support levels include the MA7 at $1,906, the $1,894 area (today’s low), and the $1,848 level (7-day low). A break below $1,848 would signal a short-term trend reversal. On the upside, a move above $1,981 (30-day high) would open the path to $2,000 psychological resistance. The declining volume suggests that ETH may need a catalyst to break out, or it could correct to re-test support.
Key Technical Levels
| Asset | Support | Resistance | RSI |
|---|---|---|---|
| BTC | $64,363 (MA7), $63,600 | $65,809 (7d high), $66,956 (30d high) | Neutral (56.0) |
| ETH | $1,906 (MA7), $1,848 | $1,981 (7d/30d high), $2,000 | Neutral (57.9) |
BTC vs ETH Dynamic
The correlation between Bitcoin and Ethereum remains high but is showing signs of divergence in strength. Over the past 30 days, ETH has outperformed BTC by a margin of 11.55 percentage points (19.80% vs 8.25%), indicating a clear rotation into altcoins. On July 30, BTC’s 1.55% gain outpaced ETH’s 0.91%, but this is a single-day snapshot. The 7-day performance shows ETH (+2.65%) still leading BTC (-0.19%). The ETH/BTC ratio has been rising, suggesting that capital is flowing from BTC into ETH and potentially other altcoins. This dynamic is typical of the mid-cycle phase of a crypto bull market, where Bitcoin stabilizes and altcoins catch up. However, the declining volume on both assets suggests that the overall market is waiting for a catalyst. If BTC breaks above $66,956, it could trigger a broader rally that lifts ETH as well. Conversely, a BTC breakdown below $62,742 would likely drag ETH below $1,848.
Strategy Fit
Based on the current market conditions—consolidation near resistance with declining volume—the most suitable strategy is grid trading on a neutral range. Both BTC and ETH are trading in well-defined ranges: BTC between $63,600 and $65,800, and ETH between $1,848 and $1,981. The neutral RSI readings support a range-bound approach.
For Pionex users, the BTC/USDT Grid Bot can be deployed with a range of $63,000 to $66,000, capturing the current consolidation zone. Similarly, an ETH/USDT Grid Bot with a range of $1,850 to $2,000 would align with the key support and resistance levels. The low volume environment is ideal for grid trading, as it allows the bot to accumulate profits from small price oscillations without the risk of a sudden breakout.
Alternatively, a DCA (Dollar-Cost Averaging) strategy can be employed for longer-term accumulation. Given that both assets are above their 30-day moving averages and in an uptrend, DCA can capture the trend without timing the market. Pionex’s DCA Bot can be set to buy BTC and ETH daily or weekly, with the option to set a take-profit target.
Trend following is not recommended at this time due to the declining volume and consolidation near resistance. A trend-following strategy would require a confirmed breakout above the 30-day highs, which has not yet occurred. Patience is key.
Risk Disclaimer
This analysis is for informational and educational purposes only and does not constitute financial advice. Cryptocurrency markets are highly volatile and involve substantial risk. Past performance is not indicative of future results. Always conduct your own research and consult with a qualified financial advisor before making any investment decisions. The technical levels and strategies discussed are based on current market data and may change rapidly. Trading bots, including those offered by Pionex, do not guarantee profits and can result in losses. Never invest more than you can afford to lose.
FAQ
Q: Why is ETH outperforming BTC in July 2026?
A: ETH has gained 19.80% over the past 30 days compared to BTC’s 8.25%, driven by capital rotation into altcoins after Bitcoin’s initial rally. The ETH/BTC ratio has been rising, and ETH’s golden cross (MA7 crossing above MA30) earlier in July provided a technical catalyst. Additionally, market sentiment favors Ethereum due to its active ecosystem and upcoming network upgrades.
Q: What does the declining volume on both BTC and ETH indicate?
A: Declining volume near resistance levels suggests that the market lacks conviction to push prices higher. BTC’s volume is 0.92x the 7-day average, while ETH’s is only 0.49x. This can precede a pullback or a consolidation period. Traders should watch for a volume spike to confirm a breakout or breakdown.
Q: Is the RSI of 56.0 on BTC bullish or bearish?
A: An RSI of 56.0 is neutral, meaning BTC is neither overbought (above 70) nor oversold (below 30). This leaves room for movement in either direction. A rising RSI above 60 would indicate growing bullish momentum, while a drop below 50 would signal weakening.
Q: What are the key levels to watch for a breakout?
A: For BTC, a breakout above $65,809 (7-day high) targets $66,956 (30-day high). A breakdown below $62,742 (7-day low) would signal a bearish reversal. For ETH, a breakout above $1,981 (30-day high) targets $2,000 psychological resistance, while a breakdown below $1,848 (7-day low) would indicate weakness.
Q: Which Pionex bot is best suited for the current market?
A: The Grid Trading Bot is ideal for the current consolidation phase, as it profits from price oscillations within a defined range. For BTC, set a range of $63,000 to $66,000; for ETH, set a range of $1,850 to $2,000. Alternatively, the DCA Bot can be used for long-term accumulation, buying fixed amounts daily or weekly to average out the entry price.


