BTC ETH Daily Recap — 2026-08-01

BTC ETH Daily Recap — 2026-08-01
Today at a Glance
Bitcoin (BTC) and Ethereum (ETH) are both trading in a narrow, low‑volatility range to start the first day of August. BTC is at $63,070, up 0.29% over the last 24 hours, with a session high of $63,150 and a low of $62,888. The asset remains below both its 7‑day and 30‑day moving averages ($63,970 and $64,095 respectively), and its RSI(14) sits at 41.5 — a neutral‑to‑slightly‑bearish reading. Trading volume has dried up considerably, at just 0.3× the 7‑day average.
ETH is marginally stronger on the day, up 0.37% to $1,869, with a 24‑hour range of $1,862–$1,872. While its 7‑day change is nearly flat (−0.29%), the 30‑day picture is more constructive, with ETH up 6.32% from its July low near $1,695. ETH’s RSI is balanced at 50.8, and it is trading above its 30‑day MA ($1,851) but below its 7‑day MA ($1,904). Volume, however, is extremely thin at only 0.18× the weekly average, suggesting limited conviction on either side.
Bitcoin Analysis
TradingView Live (4h)
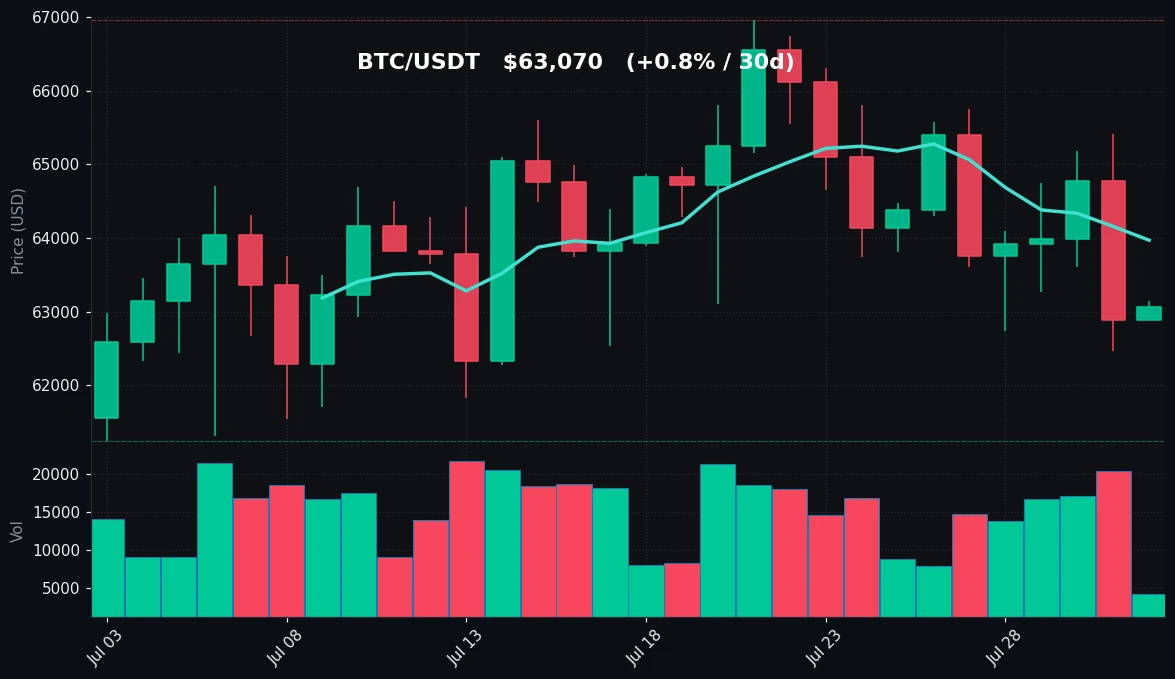
Bitcoin is consolidating in a tight band after a week of mild losses. The 7‑day performance is −2.03%, with the weekly high of $65,745 giving way to a pullback that found support near $62,466 — a level that has held twice in the last seven days. The current price of $63,070 sits roughly midway between that support and the 7‑day moving average at $63,970.
The technical structure is mixed but not overtly bearish. BTC is below both its MA7 ($63,970) and MA30 ($64,095), which typically signals short‑term weakness. However, the gap between the two moving averages is narrow (about $125), indicating that the market has been range‑bound for several weeks rather than in a clear trend. The 30‑day high of $66,956 and low of $61,249 define a broad consolidation zone, and the current price is closer to the midpoint than to either extreme.
RSI(14) at 41.5 reflects mild selling pressure but remains above the oversold threshold of 30. This suggests that the recent decline has not been accompanied by excessive momentum, and that buyers have stepped in near the $62,500–$63,000 zone. Volume is the most notable concern: at 0.3× the 7‑day average, participation is extremely low. Low volume often precedes a breakout, but the direction of that breakout is uncertain. In the absence of volume, price moves are more susceptible to whipsaws.
Key levels to watch include immediate support at $62,466 (the recent weekly low) and resistance at $63,970 (MA7) followed by $64,095 (MA30). A sustained close above the MAs would shift the short‑term bias neutral‑to‑positive, while a break below $62,466 would open the door to the $61,249 support level from the 30‑day range. The market is currently in a wait‑and‑see mode, with no clear directional catalyst.
Ethereum Analysis
TradingView Live (4h)
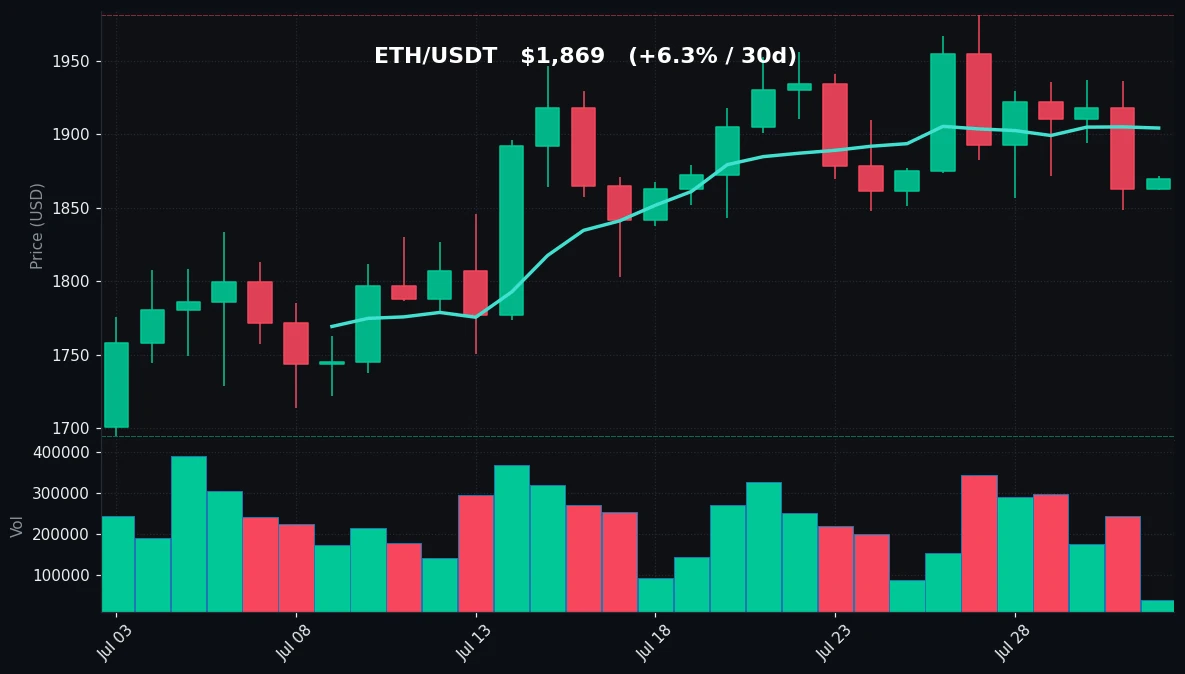
Ethereum is showing relative resilience compared to Bitcoin, though its trading activity is even thinner. At $1,869, ETH is up 0.37% on the day, within a narrow $10 range. The 7‑day change is nearly flat (−0.29%), but the 30‑day performance of +6.32% stands out, driven by a recovery from the $1,695 low seen earlier in the month. The 30‑day high of $1,981 was recorded within the last week, followed by a pullback that found support at $1,849.
Technically, ETH is in a slightly more constructive position than BTC. It is trading above its 30‑day moving average ($1,851) but below its 7‑day MA ($1,904). The fact that the 30‑day MA is trending upward and price is above it suggests that the medium‑term bias is still positive, while the short‑term dip below the MA7 reflects the recent consolidation. The RSI at 50.8 is perfectly neutral, indicating balanced buying and selling pressure.
The volume picture is even more extreme than for BTC — at just 0.18× the 7‑day average, ETH is experiencing an almost complete lack of participation. This is typical of a market awaiting a catalyst, and it makes the current price levels less reliable as indicators of genuine supply/demand equilibrium. The narrow 24‑hour range ($1,862–$1,872) underscores the absence of momentum.
Key levels for ETH are support at $1,849 (the recent weekly low) and $1,819 (the 30‑day low area), with resistance at $1,904 (MA7) and $1,981 (the 30‑day high). A break above $1,904 would likely trigger a test of $1,981, given the lack of intermediate resistance. Conversely, a loss of $1,849 could lead to a retest of the $1,800 psychological level. The RSI does not indicate overbought or oversold conditions, and the price is essentially at a technical inflection point.
Key Technical Levels
| Asset | Support | Resistance | RSI |
|---|---|---|---|
| BTC | $62,466 | $63,970 (MA7), $64,095 (MA30) | Neutral (41.5) |
| ETH | $1,849 | $1,904 (MA7), $1,981 (30d high) | Neutral (50.8) |
BTC vs ETH Dynamic
The correlation between Bitcoin and Ethereum remains high in the current environment, as evidenced by their nearly identical 24‑hour price changes (+0.29% vs +0.37%) and similar 7‑day trajectories (−2.03% vs −0.29%). However, there is a notable divergence in their medium‑term performance: ETH has gained 6.32% over the last 30 days while BTC is up only 0.78%. This suggests that ETH is currently the stronger asset on a relative basis, likely due to a more constructive fundamental backdrop or simply a lag effect from its earlier underperformance. In the short term, both assets are moving in lockstep, but any significant move in BTC would likely be amplified in ETH, given the latter’s thinner liquidity and lower volume. The ETH/BTC ratio has been trending upward, and this dynamic is worth monitoring for signs of a sustained shift in relative strength.
Strategy Fit
Given the current market conditions — extremely low volume, narrow trading ranges, and RSI levels near neutral — the most appropriate strategy is a range‑bound approach rather than trend‑following. For BTC, the well‑defined support at $62,466 and resistance at $63,970–$64,095 provide a clear grid trading zone. A grid bot that places buy orders near support and sell orders near resistance would be able to capture small profits from the oscillation, provided the range holds. The low volatility (24h range of only $262 for BTC) makes grid trading particularly effective, as price movements are frequent enough to trigger orders but not large enough to cause significant adverse moves.
For ETH, the situation is similar but with a wider relative range. The support at $1,849 and resistance at $1,904–$1,981 offer a slightly larger grid opportunity. However, the extremely low volume (0.18× average) means that grid order fill rates could be slower, and there is a risk of a sudden volume spike breaking the range. A hybrid approach — combining a grid with a stop‑loss outside the range — could mitigate this risk.
DCA (Dollar‑Cost Averaging) is also viable, particularly for ETH, given its stronger 30‑day trend. However, with RSI near 50 and no clear trend, DCA is less efficient than grid trading in a sideways market. Trend‑following strategies are not recommended at this time, as neither asset is exhibiting a clear directional bias. Pionex’s built‑in grid trading bots (both classic and leveraged) are well‑suited to this environment, as they automatically place orders at predefined intervals and require minimal manual intervention. The low‑volatility regime is ideal for these bots to accumulate small gains over time. For more conservative traders, a simple DCA plan into ETH, given its relative strength, could be considered, but the lack of volume warrants caution.
Risk Disclaimer
This market recap is for informational and educational purposes only and does not constitute financial, investment, or trading advice. Cryptocurrency markets are highly volatile and involve substantial risk of loss. Past performance, technical indicators, and price levels are not reliable predictors of future results. You should conduct your own research and consult with a qualified financial advisor before making any investment decisions. The data presented here is based on publicly available information as of 2026-08-01 and may be subject to change without notice. Neither the author nor Pionex assumes any liability for any losses arising from the use of this information. Always trade responsibly and never invest more than you can afford to lose.
FAQ
Q1: Why is Bitcoin’s RSI at 41.5 if the price is only slightly down over 24 hours?
RSI (Relative Strength Index) is a momentum oscillator that measures the magnitude of recent price changes. A reading of 41.5 indicates that over the past 14 periods, selling pressure has slightly outweighed buying pressure. The 24‑hour change of +0.29% is a very short‑term snapshot, while RSI looks at a longer window (14 days). The 7‑day decline of −2.03% has contributed to the RSI being below 50, even though today’s price action is mildly positive.
Q2: What does “Vol vs 7d avg: 0.3x” mean for BTC?
It means that the current trading volume is only 30% of the average volume seen over the last 7 days. This is a significant drop in activity, indicating that fewer traders are participating. Low volume can lead to exaggerated price moves in either direction, but it can also mean that the current price range is not being tested by genuine supply/demand. In a low‑volume environment, technical levels are less reliable.
Q3: Is ETH’s 30‑day gain of +6.32% a sign of a new uptrend?
Not necessarily. While a positive 30‑day change is constructive, the 7‑day change is nearly flat (−0.29%), suggesting that the recent momentum has stalled. The price is above the 30‑day MA but below the 7‑day MA, which is a conflicting signal. A sustained move above $1,904 (MA7) with increasing volume would be needed to confirm a resumption of the uptrend. Until then, the 30‑day gain is best viewed as a recovery from oversold conditions rather than a confirmed trend.
Q4: How should I interpret the support and resistance levels listed?
Support is a price level where buying interest is expected to be strong enough to prevent the price from falling further, based on historical data. Resistance is the opposite — a level where selling pressure is expected to halt an advance. These levels are not guarantees; they are areas of interest. In a low‑volume environment, these levels can be broken more easily. Traders often use them to set stop‑losses or take‑profit orders.
Q5: Why is the volume for both BTC and ETH so low today?
Low volume can result from a variety of factors, including a lack of major news catalysts, market participants waiting for a clear direction, or simply seasonal patterns (e.g., summer lull). It can also occur before a significant macro event, such as an interest rate decision or regulatory announcement. In the absence of new information, traders tend to reduce activity, leading to thinner order books and lower volume. This often precedes a period of higher volatility, but the direction of the move is unpredictable.


