BTC ETH Daily Recap — July 21, 2026

BTC ETH Daily Recap — July 21, 2026
Today at a Glance
On July 21, 2026, both Bitcoin and Ethereum posted solid gains, extending their upward momentum from the past week. Bitcoin rose 2.42% over the last 24 hours to trade at $66,837, after touching a daily high of $66,860 and a low of $65,149. The leading cryptocurrency is now up 2.76% over the past seven days and 4.40% over the last 30 days. Ethereum followed a similar trajectory, gaining 1.92% to reach $1,941, with a 24-hour range of $1,901 to $1,953. ETH’s weekly performance stands at +2.61%, while its 30-day gain is notably stronger at +12.33%. Volume for both assets remains below their 7-day averages—BTC at 0.73x and ETH at 0.94x—suggesting a cautious market despite the bullish price action. The RSI for both assets sits in neutral-to-bullish territory, with BTC at 64.6 and ETH at 68.6. Key moving averages continue to provide support, with BTC’s MA7 at $64,881 and MA30 at $62,780, while ETH’s MA7 is $1,886 and MA30 is $1,748. The overall market tone is one of measured optimism, with technical structures favoring the bulls without signs of overheating.
Bitcoin Analysis
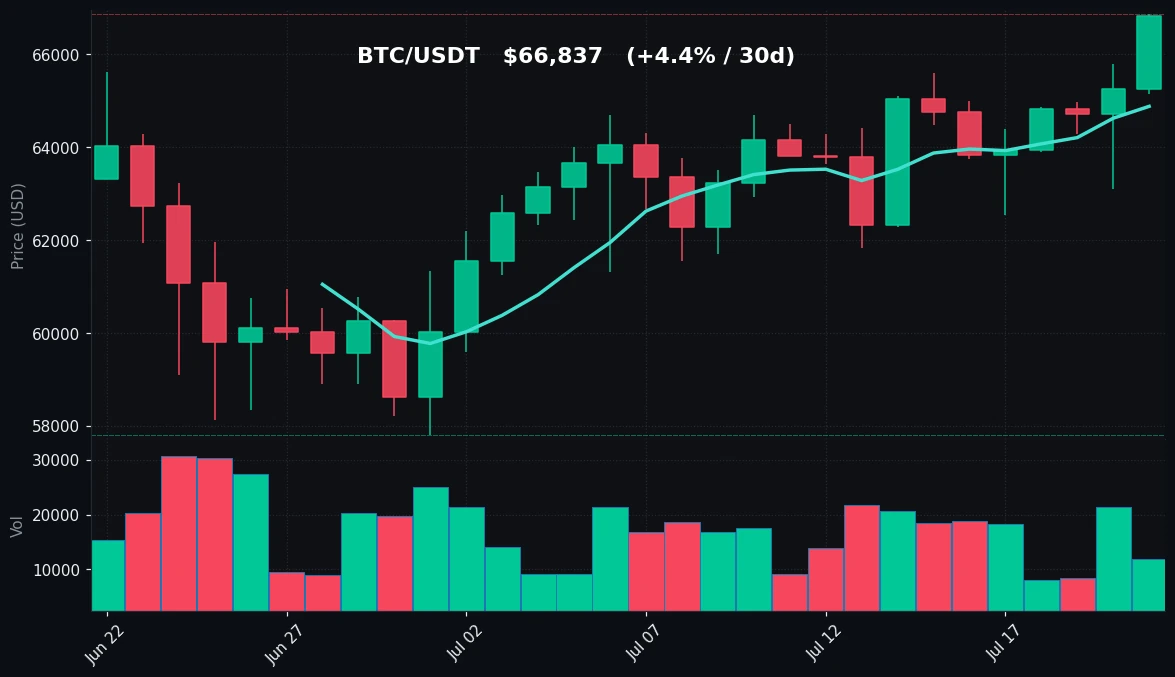
TradingView Live (4h)
Bitcoin’s price action on July 21 reflects a continuation of the recovery trend that began in late June. The asset broke above the $66,000 level intraday, reaching a new 30-day high of $66,860 before settling at $66,837. This marks the highest price point since late June, surpassing the previous 30-day high of $66,860 (also today’s high). The 24-hour low of $65,149 held firm, reinforcing the $65,000 area as near-term support.
From a technical perspective, Bitcoin is trading well above both its 7-day moving average (MA7: $64,881) and 30-day moving average (MA30: $62,780). The MA7 is currently sloping upward, indicating short-term bullish momentum. The MA30 is also rising, confirming that the medium-term trend remains positive. The gap between the two MAs—approximately $2,101—suggests the rally is accelerating, but not yet at extreme levels that would typically precede a sharp reversal.
The Relative Strength Index (RSI) stands at 64.6, which is in the upper-neutral zone. This level indicates that buying pressure is present but not excessive. An RSI above 70 would signal overbought conditions, while below 30 would indicate oversold. At 64.6, there is room for further upside before the asset enters overbought territory, which aligns with the current price trend.
Volume is a notable concern. Today’s trading volume is only 0.73 times the 7-day average, meaning that the price increase is occurring on relatively low participation. This divergence between rising price and falling volume can sometimes signal a lack of conviction behind the move, increasing the risk of a pullback if buyers fail to step in. However, low volume can also be a feature of consolidation phases where price gradually grinds higher.
Key support levels to watch include $65,149 (today’s low), $64,881 (MA7), and $62,780 (MA30). On the upside, resistance is seen at $66,860 (today’s high and 30-day high), followed by the psychological $68,000 level and the $70,000 round number. The current structure favors a test of higher resistance if volume picks up, but the low volume warrants caution.
Ethereum Analysis
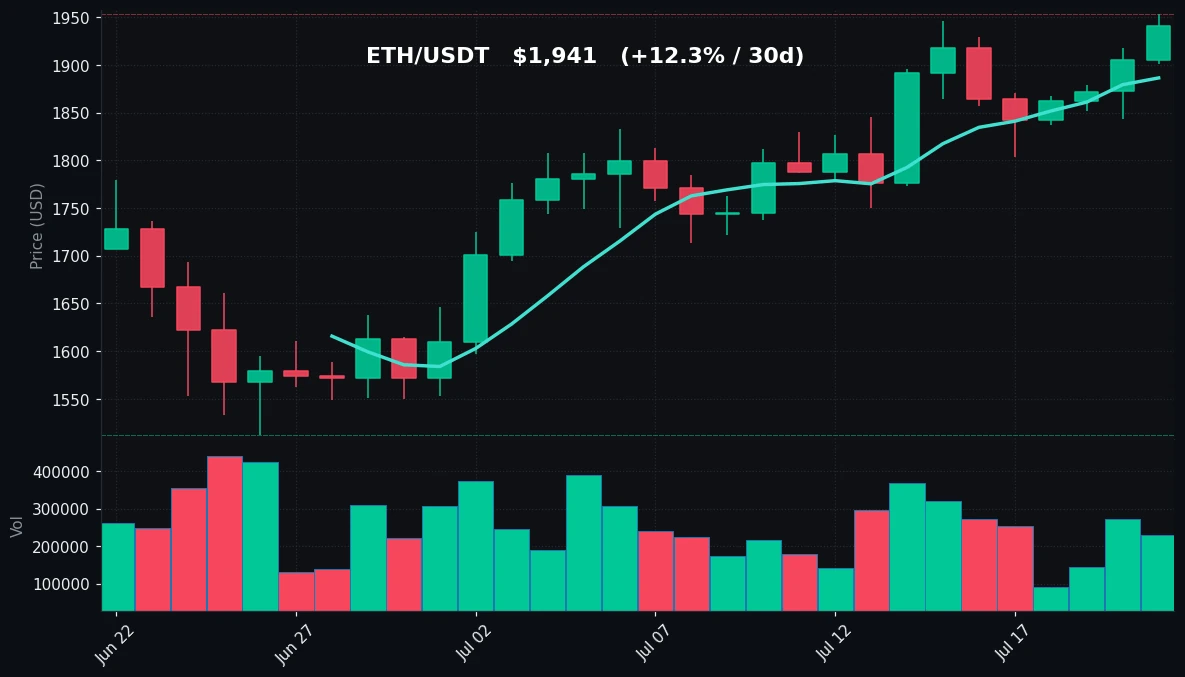
TradingView Live (4h)
Ethereum’s performance on July 21 mirrors Bitcoin’s bullish tone, with a 1.92% gain to $1,941. The asset touched a daily high of $1,953, which also represents a new 30-day high, breaking above the previous high of $1,953 (also today’s high). The 24-hour low of $1,901 provided support, and the price has held above $1,900 throughout the session.
Technically, ETH is in a strong position. It trades above both its MA7 ($1,886) and MA30 ($1,748), with the MA7 sloping upward and the MA30 also rising. The gap between the two MAs is approximately $138, indicating a healthy uptrend. The 30-day gain of +12.33% is notably stronger than Bitcoin’s +4.40%, suggesting that Ethereum is outperforming in the medium term. This could be due to factors such as increased DeFi activity, staking inflows, or relative undervaluation compared to Bitcoin.
The RSI for ETH is 68.6, which is higher than Bitcoin’s 64.6 and approaching the overbought threshold of 70. This indicates that buying pressure is stronger for ETH relative to BTC, but it also means that ETH is closer to a potential overbought condition. If the RSI crosses above 70, it may signal a short-term top and increase the likelihood of a pullback. However, in strong trends, RSI can remain elevated for extended periods.
Volume for ETH is 0.94 times the 7-day average, which is higher than Bitcoin’s 0.73x. This suggests that Ethereum’s price move has more participation behind it, lending greater credibility to the rally. The volume is still below average, but less so than BTC, indicating that ETH may have more immediate momentum.
Key support levels for ETH are $1,901 (today’s low), $1,886 (MA7), and $1,748 (MA30). Resistance is at $1,953 (today’s high and 30-day high), followed by $2,000 (psychological resistance) and $2,050. The current technical setup favors continued upside, but the elevated RSI warrants monitoring for signs of exhaustion.
Key Technical Levels
| Asset | Support | Resistance | RSI |
|---|---|---|---|
| BTC | $65,149 (24h low), $64,881 (MA7), $62,780 (MA30) | $66,860 (30d high), $68,000, $70,000 | 64.6 (neutral) |
| ETH | $1,901 (24h low), $1,886 (MA7), $1,748 (MA30) | $1,953 (30d high), $2,000, $2,050 | 68.6 (neutral, approaching overbought) |
BTC vs ETH Dynamic
The correlation between Bitcoin and Ethereum remains strong, as both assets moved in tandem on July 21. BTC gained 2.42% while ETH rose 1.92%, indicating a slight outperformance by Bitcoin on the day. However, over the 30-day period, ETH’s +12.33% gain significantly outpaces BTC’s +4.40%, suggesting that Ethereum is catching up after lagging earlier in the quarter. The ETH/BTC ratio has been rising, which typically signals risk-on sentiment as traders rotate into altcoins. The RSI divergence—64.6 for BTC vs 68.6 for ETH—confirms that ETH is experiencing stronger buying pressure. If both assets maintain their upward trajectories, ETH may continue to outperform in the near term, though the elevated RSI could lead to a temporary pullback. The volume dynamic also favors ETH, as its volume is closer to average (0.94x) compared to BTC (0.73x), indicating more conviction behind ETH’s move.
Strategy Fit
Given the current market conditions—both assets in uptrends with neutral-to-bullish RSI and below-average volume—a balanced approach is recommended. The low volume suggests that the market is not yet in a high-volatility phase, which makes aggressive directional strategies less suitable.
Grid Trading: This environment is ideal for grid trading bots, such as those available on Pionex. The relatively low volatility and gradual trend allow grid strategies to capture small price movements within a defined range. For BTC, a grid between $64,000 and $68,000 could capture the current consolidation zone. For ETH, a grid between $1,850 and $2,000 would align with the current trading range. Grid bots profit from mean reversion, which is typical in low-volume environments.
DCA (Dollar-Cost Averaging): DCA remains a sound strategy for long-term holders. The uptrend is intact, and both assets are above their moving averages. Regular DCA purchases at current levels can accumulate positions without timing the market. This is particularly relevant for ETH, which has shown stronger 30-day momentum.
Trend Following: The current trend is bullish, but the low volume and neutral RSI suggest that the trend is not yet accelerating. Trend-following strategies (e.g., trailing stop orders or trend-following bots) could be employed, but with caution. A break above $67,000 for BTC or $1,970 for ETH with higher volume would confirm trend strength and justify increased exposure.
Caution: Avoid overleveraging in this environment. The low volume increases the risk of sudden reversals, especially if a major news event triggers a volume spike. Use stop-losses or limit orders to manage risk. Pionex’s built-in bots, such as the Infinity Grid or Rebalancing Bot, can automate these strategies while managing risk.
Risk Disclaimer
This market recap is for informational and educational purposes only. It does not constitute financial advice, investment recommendations, or a solicitation to buy or sell any cryptocurrency. Cryptocurrency markets are highly volatile and involve substantial risk, including the potential loss of principal. Past performance is not indicative of future results. Always conduct your own research and consult with a qualified financial advisor before making investment decisions. The technical levels and strategies discussed are based on historical data and market conditions as of July 21, 2026, and may not be applicable in future scenarios.
FAQ
Q: Why is Bitcoin’s volume lower than its 7-day average despite the price increase?
A: Low volume on a price increase can indicate that the move is driven by a small number of buyers rather than broad market participation. This sometimes signals a lack of conviction, increasing the risk of a pullback if buying pressure wanes. It can also be a feature of consolidation phases where price gradually trends higher without high activity.
Q: Is Ethereum’s RSI of 68.6 a concern?
A: An RSI of 68.6 is approaching the overbought threshold of 70 but is not yet a sell signal. In strong trends, RSI can remain elevated for extended periods. However, it does suggest that buying pressure is strong and that a short-term pullback or consolidation could occur. Traders should monitor for a break above 70, which may indicate exhaustion.
Q: What are the key levels to watch for Bitcoin and Ethereum this week?
A: For Bitcoin, the key support is $65,149 (24h low) and $64,881 (MA7), while resistance is at $66,860 (30d high) and $68,000. For Ethereum, support is at $1,901 (24h low) and $1,886 (MA7), with resistance at $1,953 (30d high) and $2,000. A break above resistance with volume would signal continuation.
Q: How does the 30-day performance difference between BTC and ETH affect trading strategies?
A: ETH’s stronger 30-day gain (+12.33% vs BTC’s +4.40%) suggests that capital is rotating from BTC to ETH or that ETH has stronger catalysts. This could favor strategies that are long ETH relative to BTC, such as pair trading or rebalancing bots. However, the higher RSI for ETH also implies higher risk of a pullback.
Q: What type of trading bot is best suited for the current market conditions?
A: Grid trading bots are well-suited for the current low-volume, trending market. They profit from small price oscillations within a range. Pionex’s Infinity Grid or Spot Grid bots can automate this strategy. For long-term accumulation, DCA bots are also effective. Avoid high-leverage or aggressive trend-following bots until volume picks up.


