BTC ETH Daily Recap — July 13, 2026

BTC ETH Daily Recap — July 13, 2026
Today at a Glance
The crypto market saw a mild pullback on July 13, 2026, with Bitcoin (BTC) declining 2.18% over the past 24 hours to trade at $62,388, while Ethereum (ETH) fell 1.81% to $1,774. Both assets exhibited lower-than-average trading volumes relative to their 7-day averages—BTC at 0.86x and ETH at 0.9x—suggesting a lack of strong directional conviction. Bitcoin’s intraday range spanned $62,164 to $64,425, while ETH fluctuated between $1,763 and $1,846. Over the weekly timeframe, BTC lost 2.58% and ETH slipped 1.42%, though ETH maintained a positive 30-day performance (+2.81%) compared to BTC’s 5.11% decline. Key technical indicators show BTC’s RSI at 58.5 (neutral) and ETH’s at 68.3 (approaching overbought territory). The market appears to be consolidating after recent volatility, with both assets trading near their 7-day moving averages.
Bitcoin Analysis
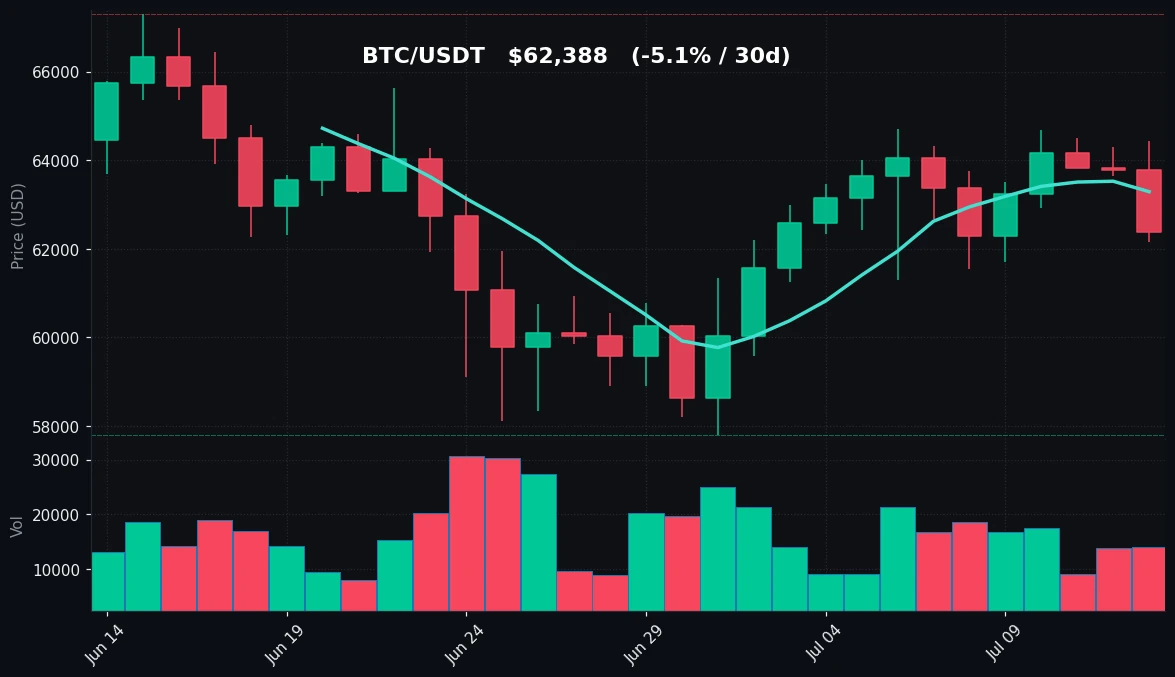
TradingView Live (4h)
Bitcoin’s price action on July 13 reflects a continuation of the short-term downtrend observed over the past week, with the asset trading at $62,388—below both its 7-day high of $64,693 and its 30-day high of $67,292. The intraday low of $62,164 tested but did not breach the 7-day support zone near $61,545, suggesting buyers are defending this level. The 7-day moving average (MA7) at $63,290 sits above the current price, indicating bearish momentum in the short term, while the 30-day moving average (MA30) at $62,687 is only slightly above the current price, hinting at potential support from longer-term holders.
Volume analysis reveals a 14% reduction in trading activity compared to the 7-day average (0.86x), which often accompanies consolidation phases. Lower volume during a price decline can indicate selling exhaustion rather than aggressive distribution. The RSI(14) reading of 58.5 places BTC in neutral territory, well below the overbought threshold of 70 and above the oversold level of 30. This suggests the asset is neither overextended nor deeply oversold, leaving room for either direction.
Key technical levels to watch include immediate resistance at $63,290 (MA7) and stronger resistance at $64,425 (24h high) and $64,693 (7d high). On the downside, support is established at $62,164 (24h low), followed by $61,545 (7d low) and the critical $57,800 (30d low). The current price action resembles a tight consolidation range, with BTC oscillating between $62,000 and $64,000 over the past several days. Without a volume catalyst, the probability of a breakout remains low, and traders should monitor the $61,500-$62,000 zone for potential accumulation signals.
Ethereum Analysis
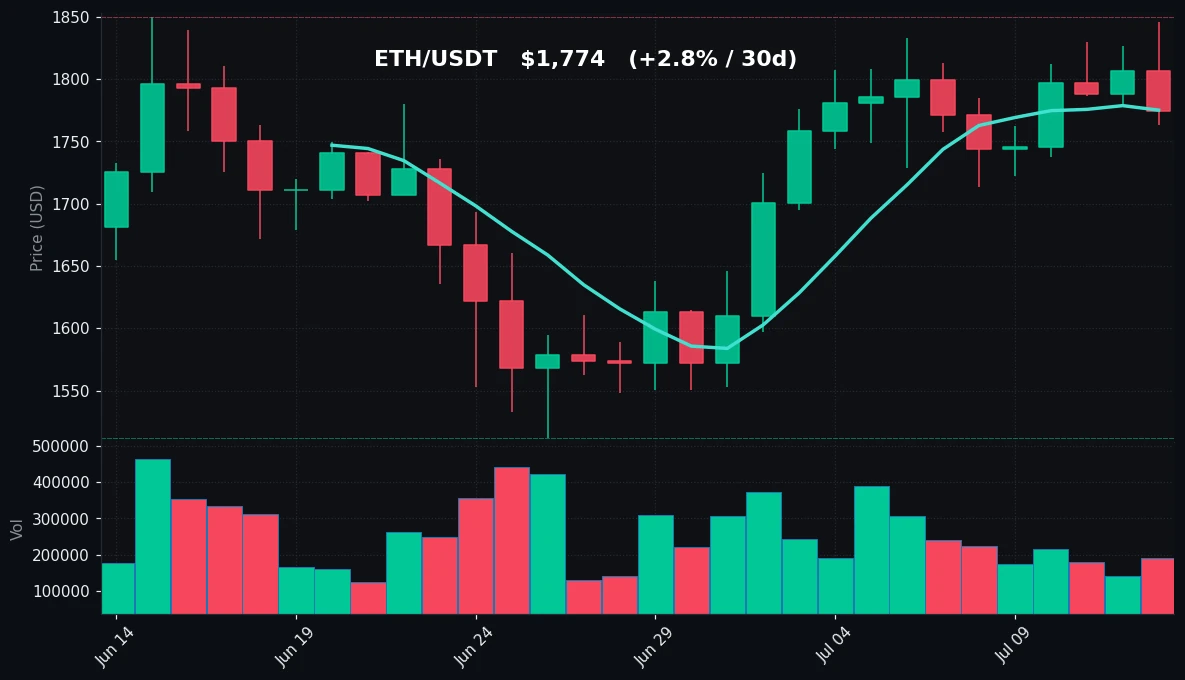
TradingView Live (4h)
Ethereum’s 24-hour decline of 1.81% brought the asset to $1,774, with an intraday range of $1,763 to $1,846. Unlike Bitcoin, ETH has shown relative strength over the past 30 days, gaining 2.81% compared to BTC’s 5.11% loss. This divergence is noteworthy and may reflect shifting capital flows within the crypto ecosystem. The 7-day moving average at $1,775 is almost exactly at the current price, indicating a neutral short-term bias, while the 30-day moving average at $1,710 provides a solid support base approximately 3.6% below current levels.
ETH’s volume at 0.9x of its 7-day average suggests slightly better participation than BTC, though still below typical activity. The RSI(14) reading of 68.3 is the most notable technical signal—this is approaching the overbought threshold of 70, suggesting that ETH may be due for a short-term pullback or consolidation. However, it is important to note that RSI can remain elevated during strong uptrends, and the 30-day performance supports a bullish bias.
The 7-day high of $1,846 and 24-hour high of $1,846 coincide, creating a strong resistance zone. A clean break above this level with volume would signal renewed bullish momentum. The 30-day low of $1,512 represents a significant support level that has not been tested recently. Immediate support lies at $1,763 (24h low) and $1,713 (7d low). ETH’s price structure appears more constructive than BTC’s, with higher lows over the past month and a MA30 that is sloping upward. The key risk is the elevated RSI, which could trigger profit-taking if the broader market remains weak.
Key Technical Levels
| Asset | Support | Resistance | RSI |
|---|---|---|---|
| BTC | $61,545 / $57,800 | $63,290 / $64,693 | 58.5 (neutral) |
| ETH | $1,713 / $1,512 | $1,846 / $1,850 | 68.3 (approaching overbought) |
BTC vs ETH Dynamic
The 30-day performance divergence between BTC (-5.11%) and ETH (+2.81%) is a notable market dynamic. This decoupling suggests capital rotation from Bitcoin into Ethereum, possibly driven by anticipation of Ethereum network upgrades, DeFi activity, or relative value plays. The 7-day correlation remains positive (both declined), but the magnitude of ETH’s resilience indicates that ETH is finding stronger buying support at current levels. Over the past 24 hours, both assets moved in tandem with similar percentage losses, but ETH’s RSI at 68.3 versus BTC’s 58.5 signals that ETH is closer to overbought conditions. Historically, such divergences can precede a period of mean reversion or signal a shift in market leadership. Traders should monitor whether ETH can maintain its relative strength if BTC continues to weaken.
Strategy Fit
Given the current market conditions—low volume, neutral RSI for BTC, and near-overbought RSI for ETH—the environment favors range-bound trading strategies over directional trend following. For Bitcoin, the tight consolidation between $62,000 and $64,000 presents an opportunity for grid trading bots, which automatically buy low and sell high within a defined price range. Pionex’s Infinity Grid Bot is well-suited for this scenario, as it can capture profits from small price oscillations without requiring a directional bias. For Ethereum, the elevated RSI suggests caution for aggressive long positions, but the 30-day uptrend supports a DCA (Dollar-Cost Averaging) approach using Pionex’s DCA bot, which accumulates positions gradually to reduce timing risk. If ETH breaks above $1,846 with volume, a trend-following bot could be activated to capture momentum. Conversely, if BTC breaks below $61,545, a short-term bearish strategy using Pionex’s leveraged grid or reverse grid bots may be considered. Overall, the current volatility (low) and volume (below average) favor conservative, automated strategies that minimize emotional decision-making.
Risk Disclaimer
This market recap is for informational and educational purposes only and does not constitute financial advice, investment recommendation, or solicitation to trade. Cryptocurrency markets are highly volatile and involve substantial risk of loss. Past performance and technical indicators are not guarantees of future results. Always conduct your own research, consider your risk tolerance, and consult with a qualified financial advisor before making any trading decisions. The author and Pionex are not responsible for any financial losses incurred.
FAQ
Q: Why is BTC underperforming ETH over the past 30 days?
A: BTC has declined 5.11% over 30 days while ETH gained 2.81%, indicating possible capital rotation. This could be driven by Ethereum-specific catalysts, relative valuation adjustments, or a shift in market sentiment favoring ETH’s ecosystem.
Q: Is ETH’s RSI of 68.3 a sell signal?
A: An RSI above 70 is typically considered overbought, but 68.3 is approaching that level without being extreme. In an uptrend, RSI can remain elevated. It suggests caution but not an automatic sell signal.
Q: What does low trading volume (0.86x for BTC) indicate?
A: Below-average volume during a price decline can suggest selling exhaustion rather than aggressive distribution. It often accompanies consolidation phases where neither buyers nor sellers dominate.
Q: Which technical level is most critical for BTC right now?
A: The $61,545 support (7-day low) is the most critical near-term level. A break below could trigger further selling toward $57,800. Conversely, a move above $63,290 (MA7) would signal short-term bullish momentum.
Q: What trading strategy is best for low-volatility conditions?
A: Grid trading bots, such as Pionex’s Infinity Grid, are ideal for range-bound, low-volatility markets. They profit from small price fluctuations without requiring a directional prediction. DCA bots are also suitable for gradual accumulation.


