BTC ETH Daily Recap | July 4, 2026

BTC ETH Daily Recap | July 4, 2026
Today at a Glance
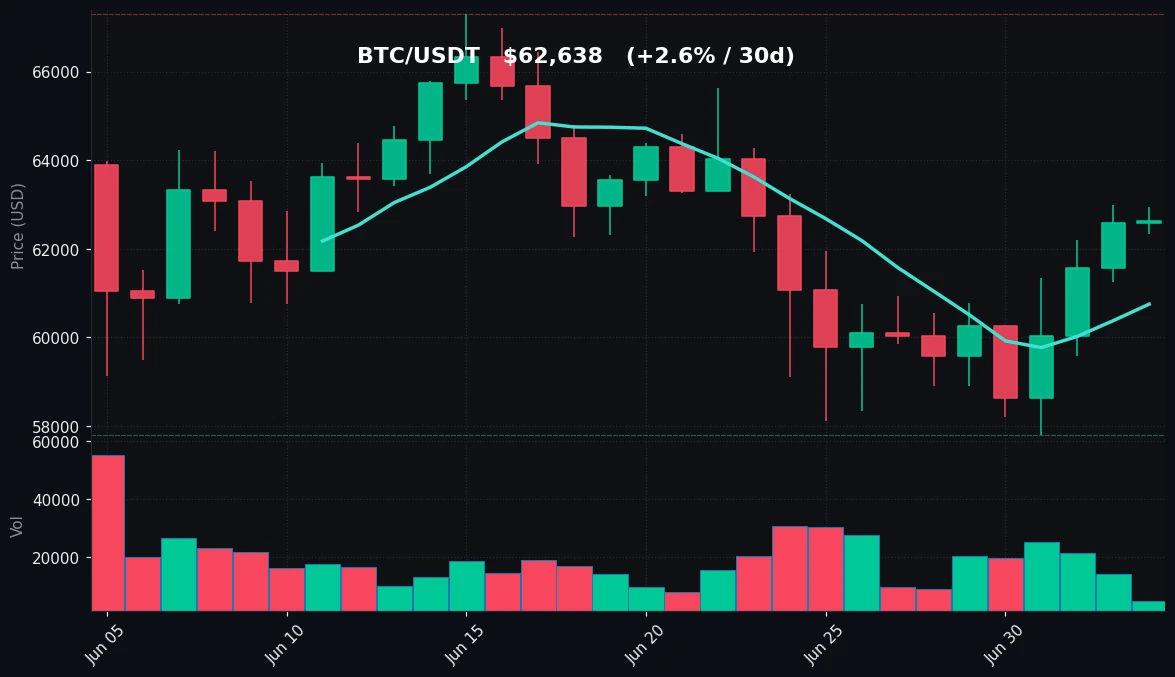
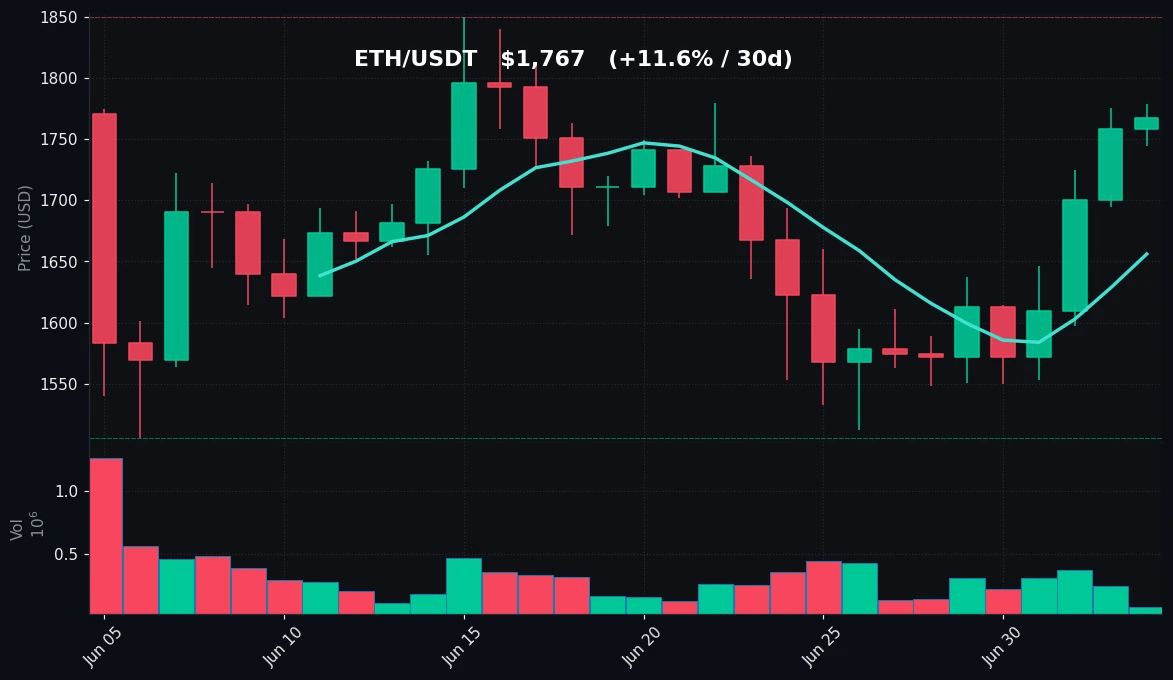
The crypto market opened the July 4 trading session with a subdued tone, as Bitcoin (BTC) edged up by a marginal +0.09% to settle at $62,638, while Ethereum (ETH) posted a slightly stronger gain of +0.50%, reaching $1,767. Bitcoin’s intraday range remained tight between $62,328 and $62,946, reflecting low volatility and reduced trading volumes—BTC’s volume was just 0.28x its 7-day average. Over a weekly timeframe, BTC gained +4.35%, recovering from a 7-day low of $57,800, while ETH outperformed with a +12.27% weekly surge, climbing from a low of $1,548 to a high of $1,779. On the 30-day horizon, BTC remains +2.59% higher but is still trading below its 30-day moving average of $62,422, while ETH’s 30-day gain of +11.60% places it comfortably above both its 7-day and 30-day MAs. RSI readings show BTC at 43.7 (approaching oversold territory) and ETH at 52.5 (neutral), suggesting divergent momentum between the two largest digital assets.
Bitcoin Analysis
TradingView Live (4h)
Bitcoin’s price action on July 4 reflects a market in consolidation, with the asset trading at $62,638, just 0.49% below its intraday high of $62,946 and 0.50% above the daily low of $62,328. The 24-hour change of +0.09% indicates minimal directional bias, as traders appear hesitant ahead of the U.S. Independence Day holiday, a period historically characterized by lower liquidity and reduced institutional participation. The 7-day trend, however, tells a more constructive story: BTC has rallied +4.35% from a weekly low of $57,800, breaking above the 7-day moving average (MA7) of $60,752 and now testing the 30-day moving average (MA30) at $62,422. Currently, BTC is trading $216 above its MA30, suggesting a potential shift from short-term bearish to neutral momentum.
Key technical levels to watch include the 7-day high of $62,980, which serves as immediate resistance. A decisive break above this level could open the path toward the 30-day high of $67,292, though such a move would require a significant increase in volume—currently at 0.28x the 7-day average, indicating extremely low participation. On the downside, support lies at the MA7 of $60,752, followed by the weekly low of $57,800. The Relative Strength Index (RSI) at 43.7 is notable: it remains below the neutral 50 mark, signaling that bearish sentiment still lingers, but it is not yet in oversold territory (typically below 30). This RSI reading, combined with the price hovering near the MA30, suggests BTC is at a critical juncture—either a breakout above $63,000 could trigger a momentum shift, or a failure to hold above $62,000 might lead to a retest of lower supports.
Volume data is a key concern. The 0.28x ratio indicates that today’s trading activity is roughly 72% below the weekly average, which often precedes sharp moves when liquidity returns. Traders should monitor whether volume picks up in the coming sessions, as low-volume consolidations frequently resolve with volatility expansion. The lack of aggressive buying or selling suggests a market waiting for a catalyst—be it macroeconomic data, regulatory news, or ETF flows.
Ethereum Analysis
TradingView Live (4h)
Ethereum’s performance on July 4 outshines Bitcoin, with a +0.50% daily gain to $1,767, reaching an intraday high of $1,779—just 3.9% below its 30-day high of $1,850. The weekly performance is particularly striking: ETH has surged +12.27% from a low of $1,548, marking a strong recovery from the $1,500 support zone. This rally has pushed ETH above both its 7-day moving average ($1,656) and its 30-day moving average ($1,669), with the current price of $1,767 representing a +6.7% premium above the MA7 and +5.9% above the MA30. Such a structure is typically bullish, indicating that short-term momentum is accelerating and that buyers are in control.
Technically, ETH’s RSI at 52.5 places it in neutral territory, but the upward slope from below 50 over the past week suggests building bullish momentum. The key resistance level to monitor is the 30-day high of $1,850, a level that has capped advances since late June. A break above $1,850 would mark a new 30-day high and potentially trigger further upside toward psychological resistance at $1,900. On the downside, immediate support is at the MA7 of $1,656, followed by the MA30 at $1,669. The weekly low of $1,548 serves as a critical floor; a drop below that would negate the recent bullish structure.
Volume for ETH is similarly low at 0.33x the 7-day average, indicating that the rally is occurring on thin liquidity. This raises the risk of sudden reversals if large sell orders emerge. However, the fact that ETH is making higher highs and higher lows on lower volume can also be interpreted as a sign of reduced selling pressure rather than lack of buying interest. The divergence between BTC and ETH is notable: while BTC struggles near its MA30 with a bearish RSI, ETH is firmly above its moving averages with neutral-to-bullish momentum. This suggests capital rotation from BTC to ETH, a pattern often seen when traders seek higher beta plays during periods of BTC consolidation.
Key Technical Levels
| Asset | Support | Resistance | RSI |
|---|---|---|---|
| BTC | $60,752 (MA7) / $57,800 (7d low) | $62,980 (7d high) / $67,292 (30d high) | 43.7 (approaching oversold) |
| ETH | $1,656 (MA7) / $1,548 (7d low) | $1,779 (7d high) / $1,850 (30d high) | 52.5 (neutral) |
BTC vs ETH Dynamic
The correlation between Bitcoin and Ethereum remains positive but has weakened over the past week, as evidenced by their divergent technical structures. Bitcoin’s RSI at 43.7 and price near its 30-day MA suggest a market in consolidation with bearish undertones, while Ethereum’s RSI at 52.5 and price well above both moving averages indicate stronger bullish momentum. This decoupling is further highlighted by the 7-day performance gap: ETH’s +12.27% gain nearly triples BTC’s +4.35% advance. Historically, such divergence often precedes a period of mean reversion, where either BTC catches up to ETH’s strength or ETH corrects toward BTC’s weakness. The current low-volume environment amplifies the risk of sudden moves in either direction. Traders should watch the BTC/ETH ratio; if it continues to decline (i.e., ETH outperforms), it could signal a broader altcoin season. Conversely, a stabilization in BTC above $63,000 could reignite correlation and pull ETH higher as well.
Strategy Fit
Given the current market conditions—low volatility, reduced volume, and divergent momentum between BTC and ETH—a multi-pronged approach is warranted. For Bitcoin, with RSI near oversold and price consolidating near the MA30, a grid trading strategy is well-suited. A narrow grid range between $60,750 (MA7 support) and $63,000 (7d high resistance) can capture small price fluctuations in a range-bound market. Pionex’s built-in spot grid bot allows traders to set automated buy and sell orders within this range, profiting from the 0.09% daily moves while avoiding emotional decision-making.
For Ethereum, the stronger uptrend and neutral RSI favor a trend-following strategy. A trailing stop-loss or a trend-trading bot (such as Pionex’s infinity grid or trailing sell bot) can capture further upside if ETH breaks above $1,779 resistance toward $1,850. However, given the low volume, a DCA (dollar-cost averaging) strategy is also prudent for both assets, as it reduces the impact of any sudden volatility. Pionex’s DCA bot can automate daily or weekly buys, accumulating positions at current levels without timing the market. For risk-averse traders, a combination of a narrow grid on BTC and a DCA on ETH provides balanced exposure to both assets while managing downside risk. Avoid leverage in this low-volume environment, as liquidity gaps can lead to slippage.
Risk Disclaimer
This market recap is for informational and educational purposes only and does not constitute financial advice, investment recommendation, or solicitation to buy or sell any digital assets. Cryptocurrency markets are highly volatile and involve substantial risk of loss. Past performance and technical indicators are not guarantees of future results. Always conduct your own research (DYOR) and consult with a qualified financial advisor before making any investment decisions. The data presented is based on publicly available information as of July 4, 2026, and may be subject to change.
FAQ
Q: Why is Bitcoin’s volume so low today?
A: Bitcoin’s volume on July 4 is 0.28x its 7-day average, indicating trading activity is 72% below the weekly norm. This is partly due to the U.S. Independence Day holiday, which reduces institutional participation and market liquidity. Low volume often precedes periods of heightened volatility when normal trading resumes.
Q: What does RSI of 43.7 mean for Bitcoin?
A: An RSI of 43.7 for Bitcoin is below the neutral 50 level, suggesting bearish momentum is slightly dominant. However, it is not in oversold territory (below 30), so there is room for further downside before a potential reversal. Traders often view RSI near 40 as a zone where buying interest may emerge.
Q: Is Ethereum’s rally sustainable given low volume?
A: Ethereum’s +12.27% weekly gain on low volume (0.33x average) raises caution. Low-volume rallies can be fragile and prone to sharp reversals if large sell orders hit the market. However, the fact that ETH is holding above key moving averages suggests genuine demand. Sustainability depends on volume picking up in the coming days.
Q: What are the most important support and resistance levels for BTC?
A: For Bitcoin, immediate support is at $60,752 (MA7), with stronger support at $57,800 (7-day low). Resistance is at $62,980 (7-day high), followed by $67,292 (30-day high). A break above $63,000 with volume could signal a trend reversal.
Q: How can I trade this market using Pionex bots?
A: For range-bound BTC, use a spot grid bot between $60,750 and $63,000. For trending ETH, consider a trailing sell bot or infinity grid to capture upside above $1,779. DCA bots are suitable for both assets to accumulate positions over time without timing the market. Always set stop-losses and monitor positions.


