BTC ETH Daily Recap | July 6, 2026

BTC ETH Daily Recap | July 6, 2026
Today at a Glance
Bitcoin (BTC) and Ethereum (ETH) both experienced mild declines over the past 24 hours, with BTC falling 2.78% to $61,880 and ETH dropping 2.20% to $1,746. Despite the short-term pullback, both assets maintain positive weekly performance: BTC is up 2.69% over the past 7 days, while ETH shows stronger weekly momentum with an 8.26% gain. BTC’s intraday range saw a high of $63,920 and a low of $61,307, while ETH traded between $1,799 and $1,729. Volume across both assets is below their 7-day averages—BTC at 0.73x and ETH at 0.51x—indicating reduced market participation. Technical indicators show BTC’s RSI(14) at 42.4, approaching oversold territory, while ETH’s RSI(14) of 51.8 sits in neutral range. BTC remains below its 30-day moving average ($62,558), while ETH continues to trade above both its 7-day ($1,708) and 30-day ($1,682) MAs, reflecting relative strength in Ethereum.
Bitcoin Analysis
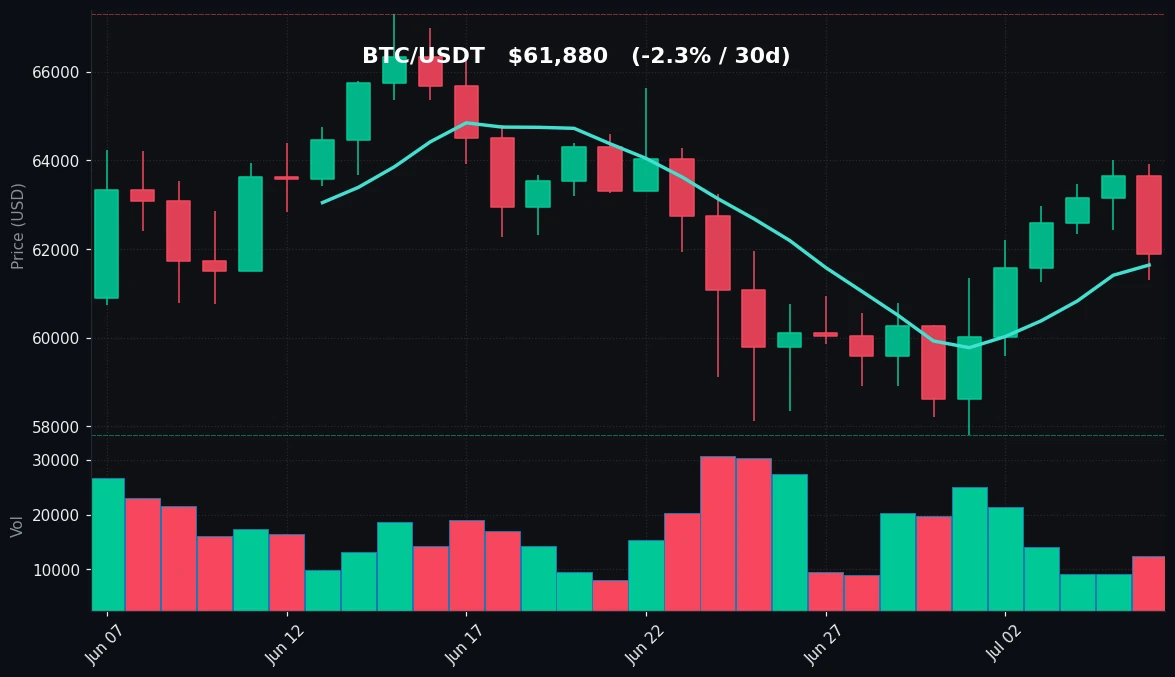
TradingView Live (4h)
Bitcoin is currently trading at $61,880, down 2.78% in the last 24 hours, after testing the $63,920 resistance level before pulling back to an intraday low of $61,307. The broader weekly picture shows a 2.69% gain, with a 7-day high of $63,999 and a low of $57,800, indicating that BTC has been oscillating within a relatively tight range over the past week. Over the 30-day horizon, BTC’s high stands at $67,292, while the low matches the 7-day low of $57,800, suggesting a roughly 14.3% range.
From a technical perspective, BTC’s price is currently sitting just above its 7-day moving average (MA7) of $61,638, but remains below the 30-day moving average (MA30) of $62,558. This positioning indicates short-term support near the MA7, but the failure to reclaim the MA30 suggests that the broader trend remains somewhat bearish. The MA30 is acting as a resistance level at approximately $62,560, and until BTC can close decisively above this level, the path of least resistance may remain to the downside.
Volume analysis reveals that BTC’s 24-hour trading volume is at 0.73x its 7-day average, reflecting lower-than-normal market activity. This volume contraction during a price decline could indicate that the selling pressure is not aggressive, but rather a lack of buying interest. If volume picks up on further downside, it could signal increased conviction from sellers.
The Relative Strength Index (RSI-14) stands at 42.4, which is in the lower neutral zone but approaching oversold territory (typically below 30). This reading suggests that BTC is not yet oversold, but selling momentum has been building. A further decline toward the $60,000–$61,000 range could push the RSI into oversold conditions, historically a zone that has attracted buyers.
Key support levels to watch include the $61,300 area (today’s low) and the $57,800 level (7-day and 30-day low). On the upside, resistance is seen at $63,920 (today’s high) and $63,999 (7-day high), with stronger resistance at the MA30 of $62,558.
Ethereum Analysis
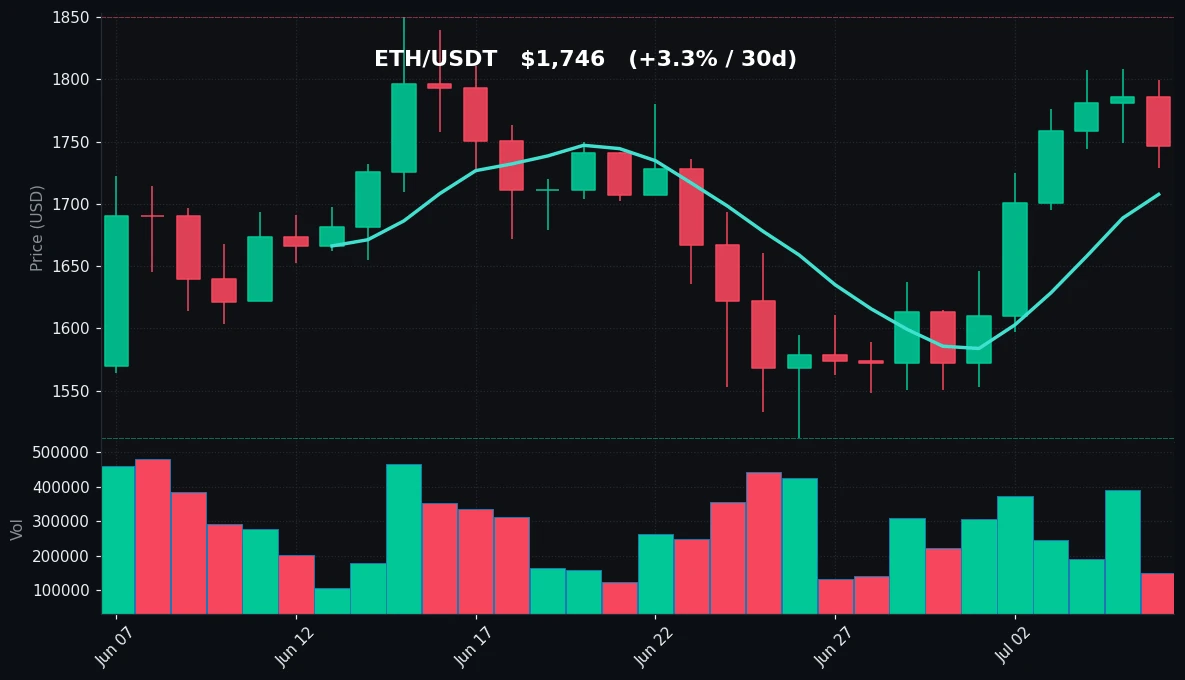
TradingView Live (4h)
Ethereum is currently trading at $1,746, down 2.20% over the past 24 hours, after reaching a high of $1,799 and a low of $1,729. Despite the daily decline, ETH’s weekly performance remains strong at +8.26%, with a 7-day high of $1,808 and a low of $1,550. Over the 30-day period, ETH is up 3.30%, with a high of $1,850 and a low of $1,512, reflecting a range of approximately 22.3%.
Technically, ETH is showing relative strength compared to BTC. The price of $1,746 is above both the MA7 ($1,708) and MA30 ($1,682), indicating that the short- and medium-term trends remain bullish. The MA7 is currently providing support at $1,708, while the MA30 at $1,682 serves as a stronger support level. ETH’s ability to hold above these moving averages suggests that buying pressure has been consistent over the past week.
Volume for ETH is notably low at 0.51x its 7-day average, which is even more subdued than BTC’s volume. This low volume during a mild pullback could indicate that the decline is not driven by panic selling, but rather profit-taking or a lack of new buyers at current levels. If ETH can maintain its position above the MA7 and MA30, the low volume may be a sign of consolidation before a potential breakout.
The RSI(14) for ETH is at 51.8, placing it in neutral territory. This is a healthier reading compared to BTC’s 42.4, as it suggests that ETH is not overbought (above 70) or oversold (below 30). The neutral RSI leaves room for movement in either direction, but the bullish alignment of price above both moving averages favors a continuation of the uptrend.
Key support levels for ETH are $1,729 (today’s low), $1,708 (MA7), and $1,682 (MA30). On the upside, resistance is at $1,799 (today’s high), $1,808 (7-day high), and $1,850 (30-day high). A break above $1,808 with volume could open the path toward the $1,850 level.
Key Technical Levels
| Asset | Support | Resistance | RSI |
|---|---|---|---|
| BTC | $61,307 / $57,800 | $63,920 / $63,999 / $62,558 (MA30) | 42.4 — neutral, approaching oversold |
| ETH | $1,729 / $1,708 (MA7) / $1,682 (MA30) | $1,799 / $1,808 / $1,850 | 51.8 — neutral |
BTC vs ETH Dynamic
The correlation between Bitcoin and Ethereum remains evident, as both assets declined in the same 24-hour period, albeit with ETH showing a slightly smaller percentage drop (-2.20% vs BTC’s -2.78%). However, the diverging technical structures are noteworthy. Ethereum is trading above both its 7-day and 30-day moving averages, while Bitcoin is below its 30-day MA. This suggests that ETH is experiencing stronger relative momentum and is leading the market in the short term. ETH’s weekly gain of 8.26% far outpaces BTC’s 2.69%, indicating that capital may be rotating from BTC into ETH or that ETH is benefiting from specific catalysts (e.g., network upgrades, DeFi activity). The ETH/BTC ratio is likely rising, and traders should monitor this pair for signs of further divergence. If BTC fails to reclaim its MA30 while ETH holds its MAs, the market may continue to favor Ethereum in the near term.
Strategy Fit
Given the current market conditions—low volume, neutral-to-oversold RSI on BTC, and neutral RSI on ETH with bullish MA alignment—a combination of strategies may be appropriate. For Bitcoin, the low volume and approaching oversold RSI suggest that a grid trading strategy could be effective, capturing profits from the expected range-bound movement between $61,000 and $63,900. Pionex’s built-in grid trading bots can automate this process, setting buy and sell orders within a defined price range. For Ethereum, the neutral RSI and price above key moving averages favor a trend-following approach, such as a trailing stop or a moving average crossover strategy. Pionex’s trend trading bots, including the Infinity Grid or Trailing Stop bot, can help capture upside momentum while managing risk. For risk-averse traders, DCA (Dollar-Cost Averaging) into both assets at current levels could be considered, given that BTC is near support and ETH is in a healthy uptrend. Pionex’s DCA bot allows for automated periodic purchases, reducing the impact of short-term volatility. Overall, a mixed approach—grid for BTC and trend/DCA for ETH—aligns with the current technical landscape.
Risk Disclaimer
This market recap is for informational and educational purposes only and does not constitute financial advice, investment recommendations, or a solicitation to buy or sell any cryptocurrency. Cryptocurrency markets are highly volatile and involve substantial risk of loss. Past performance is not indicative of future results. You should conduct your own research and consult with a qualified financial advisor before making any investment decisions. The author and Pionex shall not be held liable for any losses or damages arising from the use of this information.
FAQ
Q: Why is BTC’s RSI at 42.4 while ETH’s is at 51.8?
A: The RSI (Relative Strength Index) measures the speed and magnitude of recent price changes. BTC’s lower RSI reflects more pronounced selling pressure over the past 14 days, while ETH’s higher RSI indicates that its price has held up better relative to its recent trading range.
Q: Is the low volume on both BTC and ETH a concern?
A: Low volume can signal a lack of conviction in the current price move. For BTC, the decline on low volume may suggest that sellers are not aggressive, but it also means fewer buyers are stepping in. For ETH, low volume during a pullback could indicate profit-taking rather than panic selling.
Q: What does it mean that BTC is below its 30-day moving average?
A: The 30-day moving average (MA30) is a medium-term trend indicator. When price is below the MA30, it suggests that the average price over the last 30 days is higher than the current price, which is a bearish signal. Until BTC reclaims the MA30, the trend may be considered weak.
Q: Could ETH continue to outperform BTC?
A: Yes, based on current technical data. ETH is above both its MA7 and MA30, while BTC is below its MA30. ETH’s weekly gain of 8.26% also significantly outpaces BTC’s 2.69%. If this divergence persists, ETH may continue to lead in the short term.
Q: What are the key levels to watch for a potential trend reversal in BTC?
A: For a bullish reversal, BTC needs to close above the MA30 at $62,558 and then break the 7-day high of $63,999. For a bearish breakdown, a close below the $61,307 support (today’s low) could lead to a test of the $57,800 level.


