BTC ETH Daily Recap – July 19, 2026

BTC ETH Daily Recap – July 19, 2026
Today at a Glance
Bitcoin and Ethereum showed contrasting intraday action on July 19, 2026, with BTC slipping 0.55% to $64,477 while ETH edged up 0.47% to $1,871. BTC traded within a narrow $682 range ($64,285–$64,967), reflecting subdued momentum as volume dropped to just 0.3x its 7-day average. The king coin remains above its 7-day moving average ($64,173) and 30-day MA ($62,623), with RSI at 53.7—neutral territory. Ethereum, by contrast, extended its weekly gain to 3.57% and monthly gain to 7.48%, outperforming BTC over both timeframes. ETH’s RSI at 60.0 suggests mild bullish bias without overextension, though volume also slumped to 0.31x the 7-day average. Both assets continue to consolidate within established ranges, with BTC testing resistance near $65,600 and ETH holding above $1,860 support. The market remains in a low-volatility phase, favoring range-bound strategies.
Bitcoin Analysis
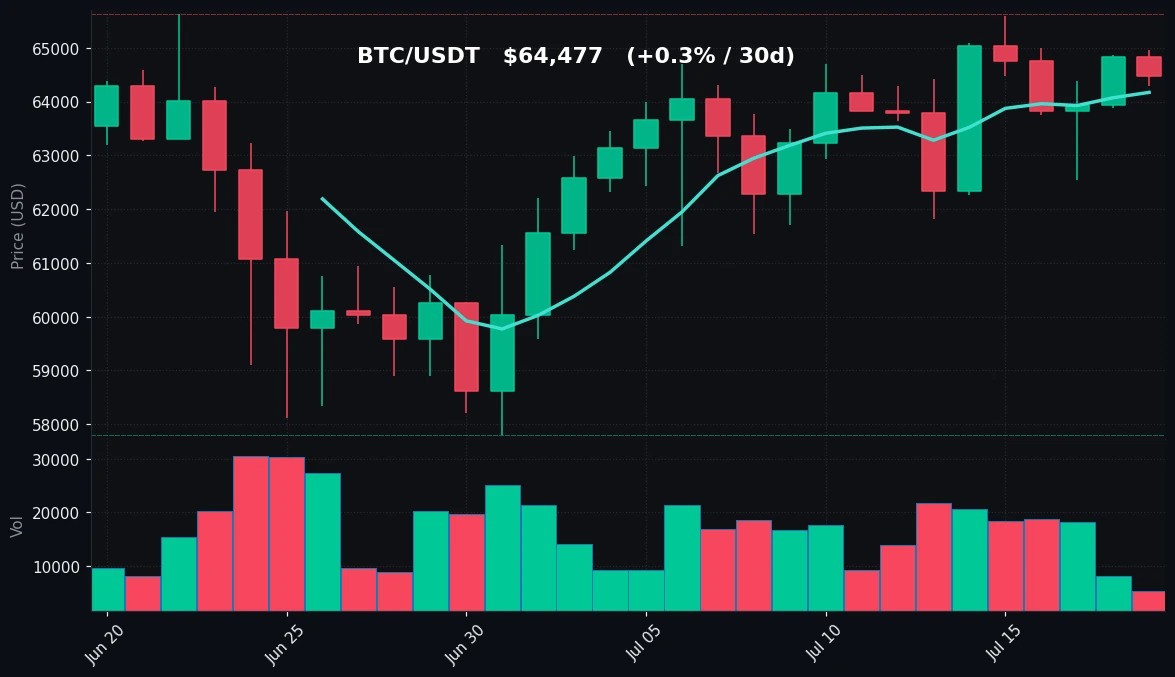
TradingView Live (4h)
Bitcoin’s price action on July 19 reflects a continuation of the consolidation pattern observed over the past week. The asset opened near $64,800 and drifted lower, touching an intraday low of $64,285 before recovering slightly to close at $64,477. This narrow $682 range is well within the 7-day high/low band of $61,825–$65,600, indicating no breakout or breakdown pressure. The 24-hour decline of 0.55% is marginal and does not alter the broader technical picture.
From a moving average perspective, BTC remains in a constructive position. The price sits above both the 7-day MA ($64,173) and the 30-day MA ($62,623), with the 7-day MA trending upward. The gap between these two averages has widened to approximately $1,550, suggesting short-term momentum is slightly ahead of the medium-term trend. However, the 30-day MA has only risen modestly from $61,800 at the start of the month, indicating that the broader uptrend is gradual rather than explosive.
The RSI(14) reading of 53.7 is firmly in neutral territory, neither overbought nor oversold. This aligns with the low volatility environment and suggests no immediate directional catalyst. Volume is the most notable concern: at 0.3x the 7-day average, participation is significantly below normal. Low volume during consolidation can precede either a breakout or a breakdown, but without a catalyst, the current range is likely to persist.
Key technical levels to watch include immediate support at $64,173 (7-day MA) and stronger support at $61,825 (7-day low). Resistance is clustered around $64,967 (24-hour high) and $65,600 (7-day high). A close above $65,600 would signal renewed bullish momentum, while a break below $61,825 could open the door to retesting the $57,800 level from 30 days ago. For now, BTC is in a wait-and-see mode.
Ethereum Analysis
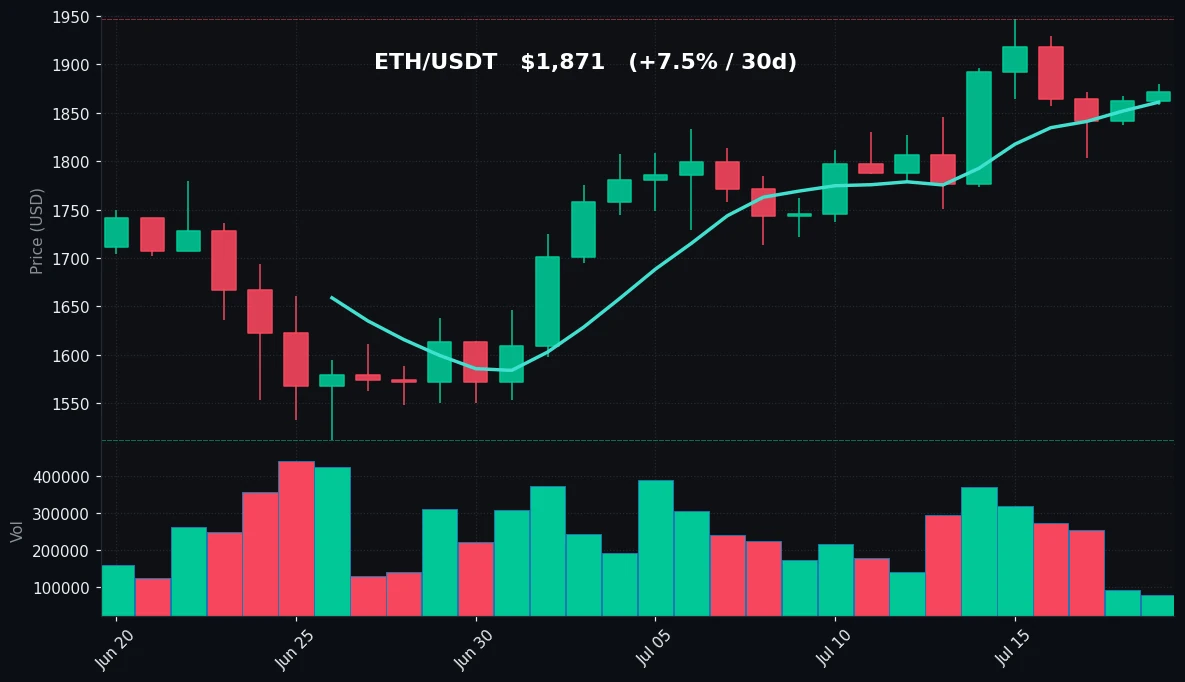
TradingView Live (4h)
Ethereum displayed relative strength on July 19, rising 0.47% to $1,871, outperforming Bitcoin on the day. The intraday range of $1,858–$1,879 was similarly tight, but the positive close marks the second consecutive day of gains. Over the past week, ETH has gained 3.57%, and over the past 30 days, it has appreciated 7.48%, significantly outpacing BTC’s 0.28% monthly gain.
Technically, ETH’s setup is more bullish than BTC’s. The price is above both the 7-day MA ($1,861) and the 30-day MA ($1,735), with the 7-day MA sloping upward. The 30-day MA has risen sharply from $1,512 a month ago, indicating a sustained recovery from the lows. The gap between the two moving averages is about $126, which is healthy but not excessive.
The RSI(14) at 60.0 is the most notable metric. It sits just below the overbought threshold of 70, suggesting that while buying pressure is present, there is still room for further upside before the asset becomes stretched. This is a more constructive reading than BTC’s neutral 53.7. However, volume is also weak here at 0.31x the 7-day average, mirroring the broader market’s low participation.
Key levels for ETH include immediate support at $1,861 (7-day MA) and stronger support at $1,750 (7-day low). Resistance is at $1,879 (24-hour high) and $1,947 (7-day and 30-day high). A break above $1,947 would mark a new 30-day high and could trigger a move toward the psychological $2,000 level. On the downside, a loss of $1,750 would negate the short-term uptrend and expose the $1,512 low from 30 days ago. ETH’s relative strength suggests it may be poised to test the upper end of its range before BTC does.
Key Technical Levels
| Asset | Support | Resistance | RSI |
|---|---|---|---|
| BTC | $64,173 (MA7), $61,825 (7d low) | $64,967 (24h high), $65,600 (7d high) | 53.7 – neutral |
| ETH | $1,861 (MA7), $1,750 (7d low) | $1,879 (24h high), $1,947 (7d/30d high) | 60.0 – neutral with slight bullish bias |
BTC vs ETH Dynamic
The correlation between Bitcoin and Ethereum remains intact, but the magnitude of moves diverges notably. Over the past 30 days, ETH has outperformed BTC by over 7 percentage points, a trend that continued today with ETH gaining while BTC slipped. This is characteristic of a market where capital is rotating toward alt-leaders during periods of low BTC volatility. The ETH/BTC ratio has risen from approximately 0.029 to 0.0295 over the past week, suggesting modest relative strength for ETH. However, both assets are trapped in narrow ranges with declining volume, indicating that the broader market lacks conviction. Until BTC breaks out of its $61,825–$65,600 range, ETH is unlikely to sustain a move above $1,947 without a catalyst. The divergence in RSI readings (53.7 vs 60.0) further supports the view that ETH has more near-term upside momentum, but the low-volume environment cautions against overinterpreting short-term moves.
Strategy Fit
Given the current low-volatility, range-bound market conditions, the most suitable trading strategies are those that capitalize on mean reversion and consolidation rather than directional trends. Grid trading is particularly well-suited for this environment. A grid bot that places buy orders near support (e.g., $64,173 for BTC, $1,861 for ETH) and sell orders near resistance (e.g., $64,967 for BTC, $1,879 for ETH) can profit from the back-and-forth price action within these tight ranges. The low volume further supports range-bound behavior, as low participation often leads to price oscillating within established levels.
Dollar-cost averaging (DCA) is also appropriate for longer-term accumulators, as both assets are above their 30-day moving averages but not overextended. A DCA strategy that buys at regular intervals can smooth out entry prices without trying to time the market.
Trend-following strategies are not recommended today, as neither asset has established a clear directional trend. The RSI for both is neutral, and volume is too low to confirm any breakout. Traders should avoid chasing moves until volume picks up and a decisive break above resistance (BTC above $65,600, ETH above $1,947) or below support occurs.
Pionex offers built-in grid trading bots that are ideal for these conditions. Users can set up a perpetual grid on BTC/USDT or ETH/USDT with upper and lower price limits based on the key technical levels above. The bot will automatically buy low and sell high within the range, requiring no manual intervention. For those preferring a passive approach, Pionex’s DCA bot can be configured to accumulate BTC or ETH at set intervals, taking advantage of the current consolidation without attempting to predict the next move.
Risk Disclaimer
This market recap is for informational and educational purposes only. It does not constitute financial advice, investment recommendations, or solicitation to buy or sell any cryptocurrency. All trading involves risk, including the potential loss of principal. Past performance is not indicative of future results. Cryptocurrency markets are highly volatile and can experience rapid price fluctuations. You should conduct your own research and consult with a qualified financial advisor before making any trading decisions. The technical levels and strategies discussed are based on historical data and may not hold under changing market conditions.
FAQ
Q: Why is Bitcoin’s volume so low today?
A: Volume is at 0.3x the 7-day average, indicating reduced trader participation. This often occurs during consolidation phases when the market lacks a clear catalyst. Low volume can precede a breakout or breakdown, so traders should watch for a volume spike to confirm the next move.
Q: Is Ethereum’s RSI of 60.0 a buy signal?
A: No. An RSI of 60.0 is in neutral territory with a slight bullish bias, but it is not a definitive buy signal. It suggests that buying pressure is present but not excessive. Traders should combine RSI with other indicators like volume and moving averages before making decisions.
Q: What are the key levels to watch for a breakout?
A: For BTC, a breakout above $65,600 (7-day high) would be bullish, while a break below $61,825 (7-day low) would be bearish. For ETH, a move above $1,947 (7-day and 30-day high) signals strength, while a drop below $1,750 (7-day low) would weaken the uptrend.
Q: How does low volume affect grid trading?
A: Low volume can reduce the frequency of grid trades, as price moves are smaller and less frequent. However, it also reduces the risk of sudden volatility that could cause a grid bot to get stuck in a losing position. Grid trading remains effective in low-volume range-bound markets.
Q: Should I use a DCA or grid bot in this market?
A: Both are viable. A DCA bot is better for long-term accumulation without timing the market, while a grid bot is ideal for profiting from short-term price oscillations within the current range. Choose based on your time horizon and risk tolerance. Pionex offers both options.


