BTC ETH Daily Recap – July 9, 2026

BTC ETH Daily Recap – July 9, 2026
Today at a Glance
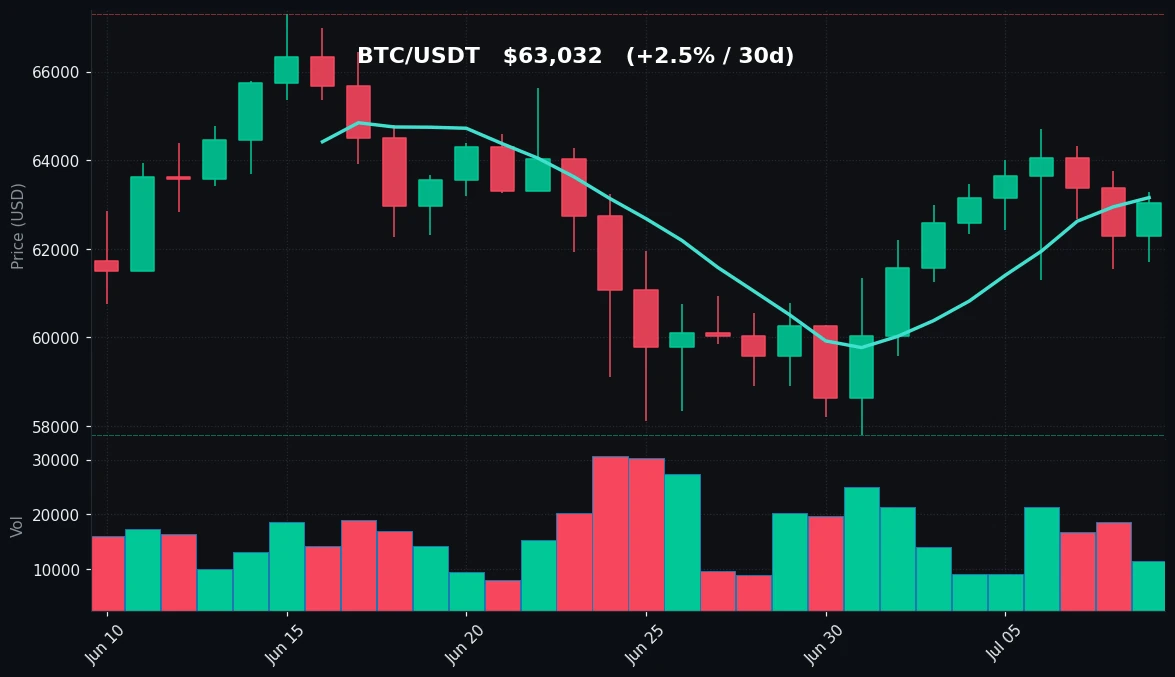
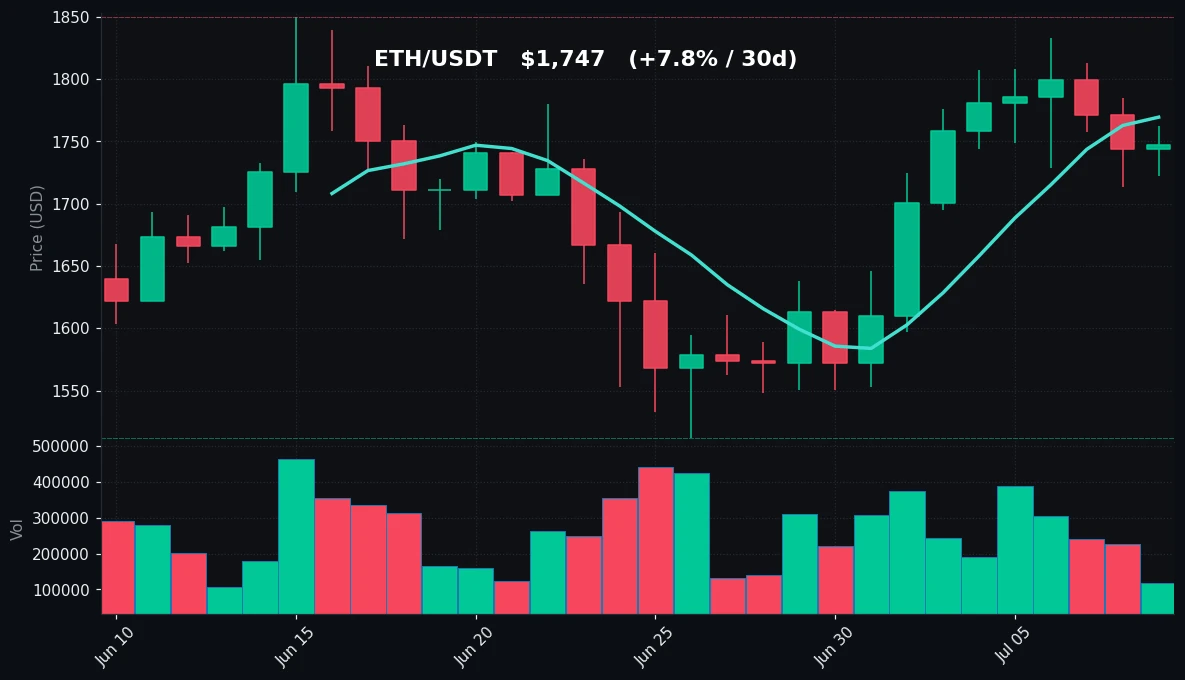
The crypto market on July 9, 2026, showed a cautious but positive tone, with Bitcoin (BTC) and Ethereum (ETH) both posting modest gains over the past 24 hours. BTC/USDT rose 1.19% to $63,032, recovering from an intraday low of $61,705 and briefly touching a high of $63,283. The 7-day trend remains bullish, with BTC up 2.39% over the week and 2.47% over the past 30 days, though trading volume fell to 0.73x the 7-day average, suggesting reduced participation. ETH/USDT edged up 0.21% to $1,747, with a daily range of $1,722 to $1,762. Over the past week, ETH gained 2.74%, and its 30-day performance of +7.75% outpaces BTC. However, ETH’s volume dropped sharply to 0.42x its 7-day average, indicating even lower liquidity relative to recent activity. Both assets are trading above their respective 7- and 30-day moving averages, reinforcing a short-term upward bias. The RSI(14) for BTC sits at 64.6, in neutral-to-bullish territory, while ETH’s RSI at 73.2 is approaching overbought levels. Overall, the market is consolidating gains from earlier weeks, with BTC showing resilience near $63,000 and ETH struggling to break above $1,760 resistance.
Bitcoin Analysis
TradingView Live (4h)
Bitcoin’s price action on July 9, 2026, reflects a market that is grinding higher but lacking decisive momentum. After hitting a 7-day high of $64,700 earlier in the week, BTC pulled back to a low of $61,249 before recovering to the current $63,032. The 24-hour range of $61,705 to $63,283 shows that intraday volatility remains contained, with no significant breakout or breakdown. The 7-day moving average (MA7) at $63,158 is just above the current price, indicating that the immediate trend is flat to slightly negative within the day, but the broader weekly trend is still positive. The 30-day moving average (MA30) at $62,648 provides solid support, as BTC has consistently traded above this level for the past week. The gap between MA7 and MA30 is narrowing, which could signal a consolidation phase before the next directional move.
The RSI(14) at 64.6 is in neutral territory, well below the overbought threshold of 70. This suggests that there is still room for upside without immediate risk of a sharp correction, but it also reflects a lack of strong buying pressure. Volume today is 0.73x the 7-day average, meaning fewer traders are active compared to the recent norm. Lower volume during a price increase can indicate a lack of conviction, making the move vulnerable to reversals. Key levels to watch include resistance at the 7-day high of $64,700 and the 30-day high of $67,292. On the downside, support is at the 7-day low of $61,249, followed by the 30-day low of $57,800. The MA30 at $62,648 is the most immediate support level, as it has held during recent dips. Overall, Bitcoin is in a neutral-to-bullish consolidation phase, with the potential for a breakout if volume picks up. However, the declining volume suggests that traders are waiting for a catalyst, such as macroeconomic data or regulatory news, to drive the next move.
Ethereum Analysis
TradingView Live (4h)
Ethereum is trading at $1,747 on July 9, 2026, showing a modest 0.21% gain over the past 24 hours. The daily range of $1,722 to $1,762 is narrow, indicating low volatility and indecision among traders. Over the past 7 days, ETH has risen 2.74%, outperforming BTC’s 2.39% gain, and its 30-day performance of +7.75% is significantly stronger than BTC’s +2.47%. This suggests that ETH has been accumulating relative strength, possibly due to expectations around network upgrades or DeFi activity. However, today’s price action is subdued, with ETH failing to challenge the 7-day high of $1,833 or the 30-day high of $1,850.
The technical picture shows that ETH is trading above both its 7-day moving average (MA7) at $1,769 and its 30-day moving average (MA30) at $1,692. The current price is slightly below the MA7, which could act as immediate resistance. The MA30 at $1,692 provides strong support, and the recent 7-day low of $1,695 is close to this level, reinforcing its importance. The RSI(14) at 73.2 is a key concern, as it is above the 70 overbought threshold. This indicates that ETH has been overextended in recent days and may be due for a pullback or consolidation. The RSI reading is the highest among major assets, suggesting that momentum is strong but at risk of exhaustion.
Volume is a major red flag for ETH today, at only 0.42x the 7-day average. This is a significant drop in trading activity, which could mean that the recent price increase is not supported by broad participation. Low volume during a period of high RSI often precedes a correction, as fewer buyers are willing to push prices higher. Key resistance levels are at the MA7 of $1,769, followed by the 7-day high of $1,833 and the 30-day high of $1,850. Support is at the MA30 of $1,692 and the 7-day low of $1,695, with the 30-day low of $1,512 as a distant floor. The volume divergence and overbought RSI suggest that traders should be cautious, as ETH may experience a short-term pullback toward the $1,690-$1,700 zone.
Key Technical Levels
| Asset | Support | Resistance | RSI |
|---|---|---|---|
| BTC | $62,648 (MA30) | $64,700 (7d high) | 64.6 – neutral |
| ETH | $1,692 (MA30) | $1,769 (MA7) | 73.2 – overbought |
BTC vs ETH Dynamic
Bitcoin and Ethereum are showing a modest positive correlation today, with both assets posting gains, but the relationship is weakening. BTC’s 24-hour gain of 1.19% is significantly larger than ETH’s 0.21%, indicating that capital may be rotating from ETH to BTC or that BTC is leading the market. Over the past 30 days, ETH has outperformed BTC by over 5%, but today’s action suggests a pause in that trend. The RSI divergence is notable: BTC’s RSI at 64.6 is healthy and neutral, while ETH’s at 73.2 is overbought. This could mean that ETH is more vulnerable to a correction, while BTC has room to run. Volume also tells a story: BTC’s volume is at 73% of its 7-day average, while ETH’s is at only 42%. This suggests that liquidity is concentrated in BTC, and ETH may be facing a liquidity crunch. The correlation between the two assets remains positive, but the divergence in technicals and volume indicates that they may decouple in the near term, with BTC potentially outperforming.
Strategy Fit
Given the current market conditions, a grid trading strategy is well-suited for both BTC and ETH. For BTC, the price is consolidating between support at $62,648 (MA30) and resistance at $64,700 (7d high), with neutral RSI and low volume. A grid bot can capture profits from range-bound movements without taking directional bets. For ETH, the overbought RSI and low volume suggest a potential pullback, so a grid with a wider range (e.g., $1,690 to $1,800) could capitalize on mean reversion. DCA (dollar-cost averaging) is also appropriate for long-term holders, as both assets are above their 30-day moving averages, indicating a bullish macro trend. However, the low volume warns against aggressive trend-following strategies. Trend trading is not recommended today due to the lack of clear momentum and reduced participation. Pionex’s built-in grid trading bots are ideal for this environment, allowing users to set upper and lower price limits to automate trades within the consolidation zone. For ETH, a short-term grid with a narrow range could exploit the 24-hour volatility, while a DCA bot can accumulate positions during any dips toward support levels. Always adjust parameters based on your risk tolerance and monitor volume for signs of a breakout.
Risk Disclaimer
This market recap is for informational and educational purposes only and does not constitute financial advice, investment recommendations, or trading signals. Cryptocurrency markets are highly volatile and involve substantial risk of loss. Past performance is not indicative of future results. The technical analysis and strategies discussed are based on historical data and may not predict future market movements. You should conduct your own research and consult with a qualified financial advisor before making any investment decisions. The author and publisher are not responsible for any financial losses or damages arising from the use of this information. Trading cryptocurrencies carries risks, including but not limited to market risk, liquidity risk, and regulatory risk. Never invest more than you can afford to lose.
FAQ
Q: Why is Bitcoin’s RSI at 64.6 considered neutral?
A: The RSI (Relative Strength Index) ranges from 0 to 100. A reading below 30 is oversold, above 70 is overbought, and between 30 and 70 is neutral. At 64.6, BTC’s RSI indicates moderate bullish momentum without being overextended, leaving room for further upside or a consolidation.
Q: Why is Ethereum’s volume so low compared to its 7-day average?
A: Volume at 0.42x the 7-day average means trading activity is 58% below the typical level. This could be due to a lack of major news, traders waiting for a catalyst, or a shift in attention to other assets like BTC. Low volume can make price moves less reliable.
Q: What does it mean that ETH’s RSI is overbought at 73.2?
A: An overbought RSI suggests that ETH has been bought aggressively in recent days, and the price may be due for a short-term pullback or consolidation. It does not guarantee a drop, but it increases the risk of a correction, especially when combined with low volume.
Q: Is it safe to buy ETH now given the overbought RSI?
A: Buying when an asset is overbought carries higher risk of a short-term decline. However, overbought conditions can persist during strong trends. It is safer to wait for a pullback toward support levels (e.g., $1,692 MA30) or use a strategy like DCA to reduce timing risk.
Q: Why does the recap recommend grid trading over trend trading today?
A: Grid trading is ideal for range-bound markets with low volatility and neutral RSI, like BTC today. Trend trading works best when there is a clear directional move with strong volume. Since volume is low and RSI is mixed, grid trading offers a more conservative approach to capture profits from price oscillations.


