BTC ETH Daily Recap — July 8, 2026

BTC ETH Daily Recap — July 8, 2026
Today at a Glance
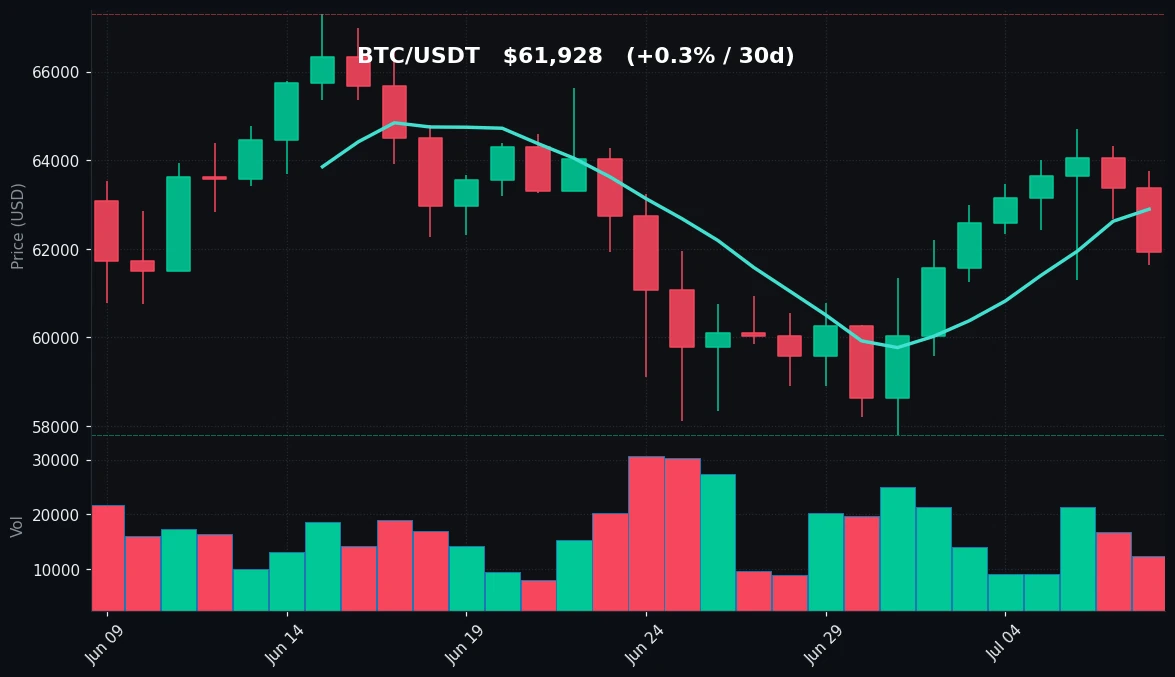
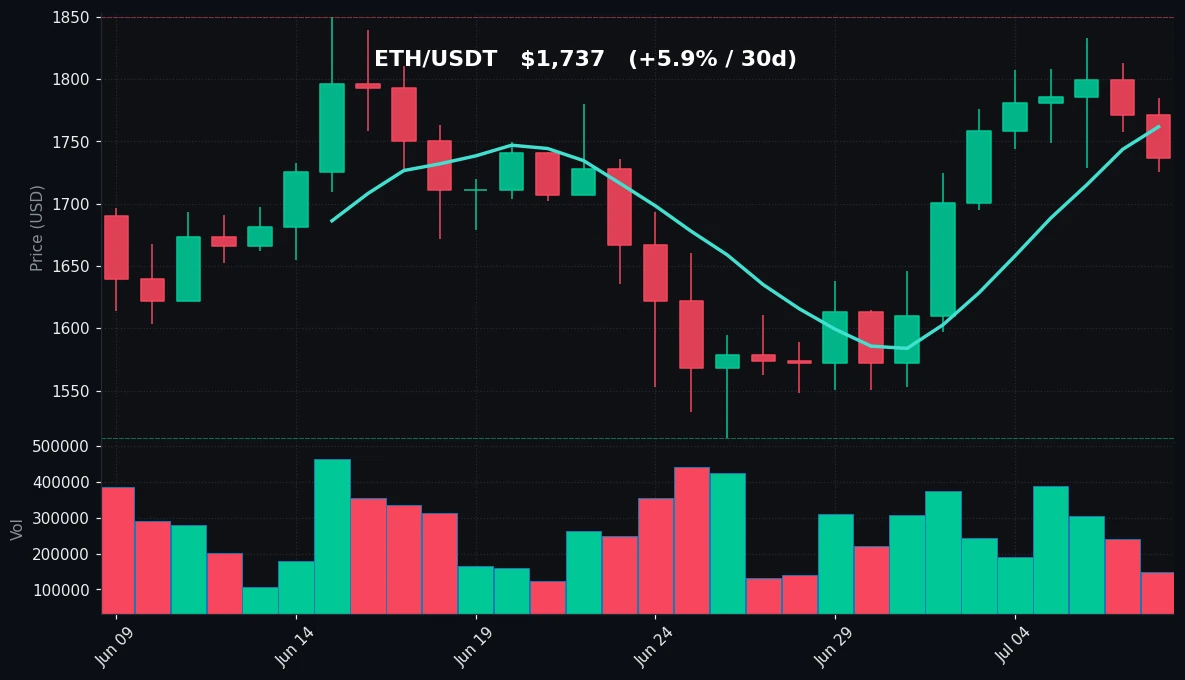
The crypto market saw a mild pullback on July 8, 2026, with both Bitcoin and Ethereum posting negative 24-hour returns. Bitcoin declined 2.27% to $61,928, retreating from its intraday high of $63,762 and briefly touching a low of $61,632. Despite the daily drop, BTC maintains a positive weekly performance of +3.17%, suggesting short-term bullish momentum remains intact. Ethereum fell 1.97% to $1,737, though its 7-day gain of +7.89% and 30-day gain of +5.92% significantly outperform Bitcoin over the same periods. ETH’s relative strength index (RSI) at 62.9 indicates stronger buying pressure compared to BTC’s neutral RSI of 53.6. Trading volumes for both assets are below their 7-day averages (BTC at 0.74x, ETH at 0.51x), signaling reduced participation during today’s session. Bitcoin remains within its recent range between $57,800 and $67,292 over the past 30 days, while Ethereum’s 30-day high of $1,850 and low of $1,512 highlight its broader volatility.
Bitcoin Analysis
TradingView Live (4h)
Bitcoin’s price action on July 8 reflects a consolidation phase following a strong weekly rally that saw BTC rise from a 7-day low of $59,588 to a high of $64,700. The current price of $61,928 sits below both the 7-day moving average (MA7) of $62,896 and the 30-day moving average (MA30) of $62,593, indicating short-term bearish pressure. However, the fact that MA7 ($62,896) remains above MA30 ($62,593) suggests the overall trend is still upward, albeit with a temporary pullback. The intraday low of $61,632 tested support near the $61,500 zone, which has acted as a pivot in recent sessions.
From a technical perspective, the RSI(14) at 53.6 places Bitcoin in neutral territory, neither overbought nor oversold. This leaves room for either direction, but the declining volume (0.74x of the 7-day average) points to a lack of conviction among sellers. The 24-hour range of $63,762 to $61,632 represents a 3.3% intraday swing, which is moderate by Bitcoin standards. The key resistance level to watch is $64,700 (7-day high), while immediate support lies at $61,632 (today’s low), followed by the 30-day low of $57,800. The lack of volume amplification suggests today’s move is more of a profit-taking event than a reversal signal.
The 30-day high of $67,292 remains a significant upside target, but BTC needs to reclaim the MA7 and MA30 levels to build momentum. The current price action is consistent with a market that is digesting recent gains, with traders cautious ahead of potential macro triggers.
Ethereum Analysis
TradingView Live (4h)
Ethereum’s performance on July 8 shows a smaller daily decline than Bitcoin, with a 1.97% drop to $1,737. ETH’s 7-day gain of +7.89% significantly outpaces Bitcoin’s +3.17%, and its 30-day return of +5.92% is also stronger. This relative strength is reflected in the RSI(14) reading of 62.9, which is closer to overbought territory (typically above 70) but still within a bullish range. The MA7 at $1,762 is above the MA30 at $1,688, confirming a short-term uptrend. However, today’s price closed below the MA7, which could signal a short-term pullback.
The intraday high of $1,785 and low of $1,725 show a narrower range than recent days, with ETH trading within a $60 band. The 7-day high of $1,833 and low of $1,597 highlight the volatility ETH has experienced, with a 14.8% swing over the past week. Volume at 0.51x of the 7-day average is notably low, suggesting that today’s move may lack follow-through. The 30-day high of $1,850 remains a key resistance level, while support is found at $1,725 (today’s low) and $1,597 (7-day low).
ETH’s outperformance relative to BTC in both the 7-day and 30-day windows suggests that capital may be rotating into Ethereum, possibly in anticipation of network upgrades or DeFi activity. The RSI at 62.9 indicates that ETH has more room to run before reaching overbought conditions, but the declining volume is a cautionary signal.
Key Technical Levels
| Asset | Support | Resistance | RSI |
|---|---|---|---|
| BTC | $61,632 (today’s low), $57,800 (30-day low) | $64,700 (7-day high), $67,292 (30-day high) | 53.6 (neutral) |
| ETH | $1,725 (today’s low), $1,597 (7-day low) | $1,833 (7-day high), $1,850 (30-day high) | 62.9 (neutral-bullish) |
BTC vs ETH Dynamic
The correlation between Bitcoin and Ethereum remains positive, with both assets declining in tandem today (-2.27% for BTC vs -1.97% for ETH). However, the divergence in weekly performance is notable: ETH’s +7.89% versus BTC’s +3.17% indicates that Ethereum is currently leading the market in terms of momentum. This is further evidenced by ETH’s higher RSI (62.9 vs 53.6) and its ability to hold above its 30-day moving average ($1,688) more decisively. The BTC/ETH ratio has tilted in favor of ETH over the past week, suggesting that traders may be shifting preference toward Ethereum for higher beta exposure. Historically, such periods of ETH outperformance can signal a broader altcoin rally, but today’s lower volumes on both assets suggest caution.
Strategy Fit
Based on today’s market data, the current environment—characterized by neutral RSI, declining volume, and price consolidation near moving averages—is well-suited for a grid trading strategy. Both BTC and ETH are trading within defined ranges (BTC: $61,632–$63,762 intraday; ETH: $1,725–$1,785 intraday), offering opportunities to profit from mean reversion. The moderate volatility (3.3% intraday range for BTC, 3.5% for ETH) supports grid spacing of 0.5% to 1% per tier.
For traders using Pionex’s built-in bots, the Grid Trading Bot can be deployed on BTC/USDT or ETH/USDT pairs to capture small price fluctuations within the current range. Given the lower-than-average volume (0.74x and 0.51x of 7-day averages), a DCA bot may also be appropriate for accumulating positions gradually, especially if the pullback extends toward support levels. The Trend Following Bot is less ideal today due to the lack of clear directional momentum (RSI neutral for BTC, near overbought for ETH). A hybrid approach—using a grid bot for short-term income and a DCA bot for long-term accumulation—would align with the current technical setup.
Risk Disclaimer
This market recap is provided for informational and educational purposes only. It does not constitute financial advice, investment recommendations, or solicitation to buy or sell any cryptocurrency. Past performance and historical data are not indicative of future results. Cryptocurrency markets are highly volatile and involve substantial risk of loss. You should consult with a qualified financial advisor before making any investment decisions. The technical analysis and strategies mentioned are based on current market conditions and may change rapidly.
FAQ
Q: Why did Bitcoin drop 2.27% today despite a positive weekly trend?
A: The drop appears to be a profit-taking event following a strong weekly rally that saw BTC rise from $59,588 to $64,700. Lower trading volume (0.74x of the 7-day average) suggests the move lacks conviction, and the neutral RSI of 53.6 indicates the market is not oversold or overbought.
Q: Is Ethereum outperforming Bitcoin right now?
A: Yes. Over the past 7 days, ETH gained +7.89% compared to BTC’s +3.17%, and over 30 days, ETH is up +5.92% versus BTC’s +0.32%. ETH’s RSI of 62.9 also shows stronger buying pressure.
Q: What are the key support levels to watch for BTC and ETH?
A: For BTC, immediate support is $61,632 (today’s low), followed by $57,800 (30-day low). For ETH, support is at $1,725 (today’s low) and $1,597 (7-day low).
Q: What does the low trading volume indicate?
A: Volume at 0.74x (BTC) and 0.51x (ETH) of the 7-day average suggests reduced market participation. This often indicates that the current price move may not be sustained, and the market could consolidate further.
Q: Which trading strategy is best for today’s market conditions?
A: Grid trading is suitable due to the defined intraday ranges and moderate volatility. DCA bots can also be used for accumulation. Trend-following strategies are less ideal given the neutral RSI and declining volume.


